Carbacid Investments Profit Rises 12% In FY2026 On Investment Gains
Carbacid Investments plc grew net profit after tax 12.21 percent to Kshs1.13 billion in the year ended 31 July 2026, as turnover held nearly flat and a 119.76 percent jump in gains on its NSE and DSE equity holdings drove most of the increase.
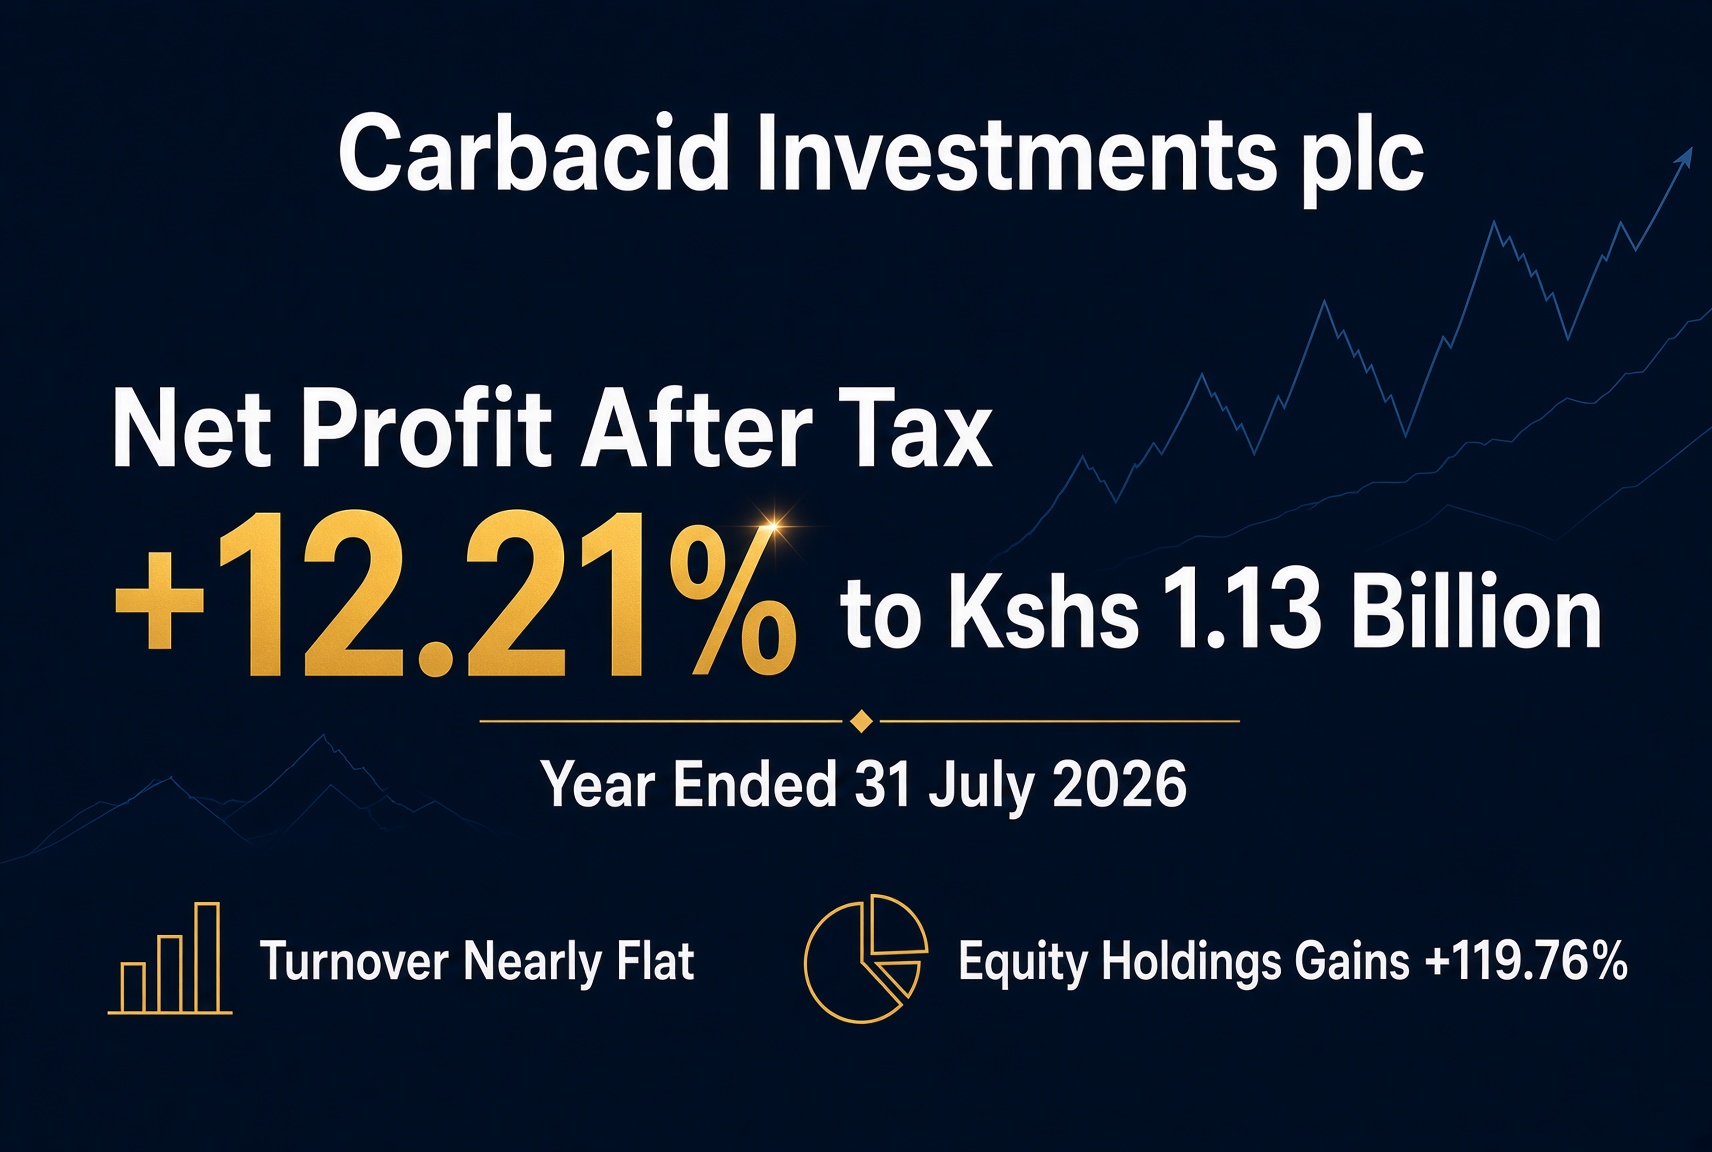
Carbacid Investments profit rises 12.21 percent in FY2026 on investment gains
Carbacid Investments plc grew net profit after tax 12.21 percent to Kshs1.13 billion for the year ended 31 July 2026, from Kshs1.00 billion a year earlier. Turnover held nearly flat, up 0.65 percent to Kshs2.11 billion, as competitive pricing offset the new customers the group added across East and Southern Africa. Earnings per share rose 12.18 percent to Shs4.42 from Shs3.94. The board proposed a final dividend of Shs2.00 per share, unchanged from last year, payable around 17 December 2026.
Most of that profit growth came from outside the core gas business. A 119.76 percent jump in gains on Carbacid's Nairobi Securities Exchange (NSE) and Dar-es-Salaam Stock Exchange (DSE) equity holdings, to Kshs266.42 million from Kshs121.23 million, accounted for the bulk of the increase in profit before tax. The company said a Kshs67 million realized gain on NSE-listed stocks and a Kshs199 million unrealized gain on DSE stocks drove that line.
Carbacid Investments plc FY2026 Snapshot (Kshs'000)
| Metric | FY2026 | FY2025 | YoY Change |
|---|---|---|---|
| Turnover | 2,113,472 | 2,099,850 | +0.65% |
| Operating profit | 1,353,127 | 1,352,668 | +0.03% |
| Other income | 330,190 | 322,516 | +2.38% |
| Administrative expenses | (477,054) | (440,031) | +8.41% |
| Fair value (loss)/gain on investment property | (522) | - | n.a. (FY2025: nil) |
| Revaluation of equity investments | 266,420 | 121,234 | +119.76% |
| Finance costs | (68,347) | (67,823) | +0.77% |
| Profit before taxation | 1,403,814 | 1,288,564 | +8.94% |
| Taxation charge | (278,460) | (285,650) | -2.52% |
| Net profit after tax | 1,125,354 | 1,002,914 | +12.21% |
| Earnings per share (Shs) | 4.42 | 3.94 | +12.18% |
| Dividend per share (Shs) | 2.00 | 2.00 | Unchanged |
Source: Carbacid Investments plc audited consolidated results for the year ended 31 July 2026.
- To analyse Carbacid's reported numbers over the last four years, click here, or see the statements themselves on its financials view.
Operating margin held essentially steady at 64.02 percent of turnover, down marginally from 64.42 percent. That stability came despite what the company called a sharp increase in input costs, including diesel prices up more than 20 percent, plus higher transport and shipping costs tied to geopolitical disruption that extended lead times.
Administrative expenses rose 8.41 percent to Kshs477.05 million from Kshs440.03 million, faster than turnover growth, and now equal 22.57 percent of turnover, up from 20.96 percent a year earlier. Finance costs were little changed, up 0.77 percent to Kshs68.35 million.
Non-current assets eased 0.70 percent to Kshs4.83 billion from Kshs4.87 billion, mostly reflecting depreciation on property, plant and equipment, which fell 1.27 percent to Kshs2.19 billion. Current assets jumped 28.60 percent to Kshs2.33 billion, while current liabilities fell 10.26 percent to Kshs580.16 million, pushing net working capital up 50.14 percent to Kshs1.75 billion.
Total equity grew 11.97 percent to Kshs5.76 billion, in step with the 12.60 percent rise in retained earnings. Borrowings fell 23.62 percent to Kshs382.33 million as the group paid down debt, while deferred income tax liabilities rose 13.69 percent to Kshs444.56 million, consistent with the unrealized gains building up in the equity portfolio.
Cash flow tells a more mixed story than the profit and loss account. Net cash from operating activities fell 14.17 percent to Kshs789.81 million from Kshs920.17 million, even as profit rose, likely reflecting the working capital build behind the 28.60 percent jump in current assets. Net cash used in investing activities shrank sharply, to Kshs45.71 million from Kshs853.29 million a year earlier, a swing that suggests FY2025 carried a large one-off investment or capital outlay that did not repeat.
Dividends paid in cash rose 17.04 percent to Kshs489.12 million from Kshs417.89 million. That is close to, but not exactly, the Kshs509.70 million final dividend charged to equity for the prior year, a normal timing gap between dividends declared and dividends actually collected by shareholders. The group also used Kshs118.23 million of cash to pay down borrowings, more than double the Kshs55.30 million used for that purpose a year earlier. Cash and bank balances still more than doubled, up 115.33 percent to Kshs255.33 million from Kshs118.58 million.
- Whether Carbacid's operating cash covers its short-term bills is tracked on its liquidity view, alongside the operating cash flow ratio and current ratio.
Carbacid Investments plc FY2026 Key Ratios
| Ratio | FY2026 | FY2025 |
|---|---|---|
| Operating margin | 64.02% | 64.42% |
| Net profit margin | 53.25% | 47.76% |
| Effective tax rate | 19.84% | 22.17% |
| Return on assets (ROA) | 15.71% | 15.01% |
| Return on equity (ROE) | 19.55% | 19.51% |
| Equity-to-assets ratio | 80.36% | 76.97% |
| Debt-to-equity ratio | 24.44% | 29.91% |
| Debt-to-assets ratio | 19.64% | 23.03% |
| Current ratio | 4.02x | 2.80x |
| Dividend payout ratio | 45.25% | 50.76% |
Source: ApexHub Insights calculations from Carbacid Investments plc's audited consolidated results for the year ended 31 July 2026.
The net margin of 53.25 percent is not a reliable guide to the core gas business on its own. A large share of profit before tax, Kshs266.42 million of Kshs1.40 billion, came from equity investment gains, not turnover, so net margin moves with stock market performance as much as with gas sales. Operating margin, at 64.02 percent of turnover, is the steadier measure of the underlying business.
Leverage improved again. Debt-to-equity fell to 24.44 percent from 29.91 percent, and debt-to-assets fell to 19.64 percent from 23.03 percent, as the group paid down borrowings and grew equity faster than liabilities. The current ratio widened to 4.02 times from 2.80 times, a comfortable liquidity cushion by any standard.
- Follow Carbacid's leverage trend on its solvency view, or compare it with other listed manufacturing companies on its peers view.
Return on equity held essentially flat at 19.55 percent from 19.51 percent, strong for a capital-light business, but the dividend payout ratio fell to 45.25 percent from 50.76 percent as profit grew faster than the unchanged Shs2.00 per share dividend. More of this year's earnings are being retained than paid out.
The board proposed a final dividend of Shs2.00 per share, unchanged from the prior year, amounting to Kshs509,703,970 in total. The register closes on 27 November 2026, and the dividend is payable on or around 17 December 2026. The Annual General Meeting will be held virtually at 10 a.m. on 17 December 2026.
- Carbacid's payout history sits on its dividend view. To track record dates and payment dates across the NSE, visit ApexHub Insights - Upcoming Dividends.
Carbacid's results also illustrate a broader exposure many Kenyan manufacturers share. Diesel and freight costs tied to global shipping lines and geopolitical tension are not specific to the gas business, and the group's reliance on equity market gains to lift profit this year is a double-edged feature. Those gains can reverse in a weaker market just as easily as they boosted this year's results.
Bottom line for investors: Carbacid's core gas business grew modestly this year, turnover up just 0.65 percent, with operating margin essentially unchanged at 64.02 percent. The headline 12.21 percent profit growth and 12.18 percent EPS growth came mostly from a good year in NSE and DSE equities, not from the underlying operations. The balance sheet is strong: low leverage, a current ratio above 4 times, and equity now covering over 80 percent of assets, which supports the unchanged Shs2.00 per share dividend even as the payout ratio fell. Investors should watch core turnover growth and operating margin for the real trend, and treat this year's investment gains as a tailwind that may not repeat.
Source: Carbacid Investments plc audited consolidated results for the year ended 31 July 2026, audited by RSM Eastern Africa LLP.
Question or correction?
Spotted a figure that looks wrong, or want something in this note explained? It comes straight to us, and is not published.
Related research
Run the numbers
- Dividend Calendar
Every declared NSE dividend with its book closure and pay dates.
- Financial Planner
Goals, income, debt and net worth projected in one plan.
- Statement Analyzer
Turn bank statements into categorised income and expenses.
- Stock Screener
Screen the NSE on the same fundamentals this note is built on.