Unga Group Profit More Than Doubles In FY2026, Declares No Dividend
Unga Group Plc's pretax profit rose 118.21 percent to Shs743.68 million in the year to June 2026 as revenue grew 16.52 percent, but operating cash flow swung deeply negative and the board recommended no dividend.
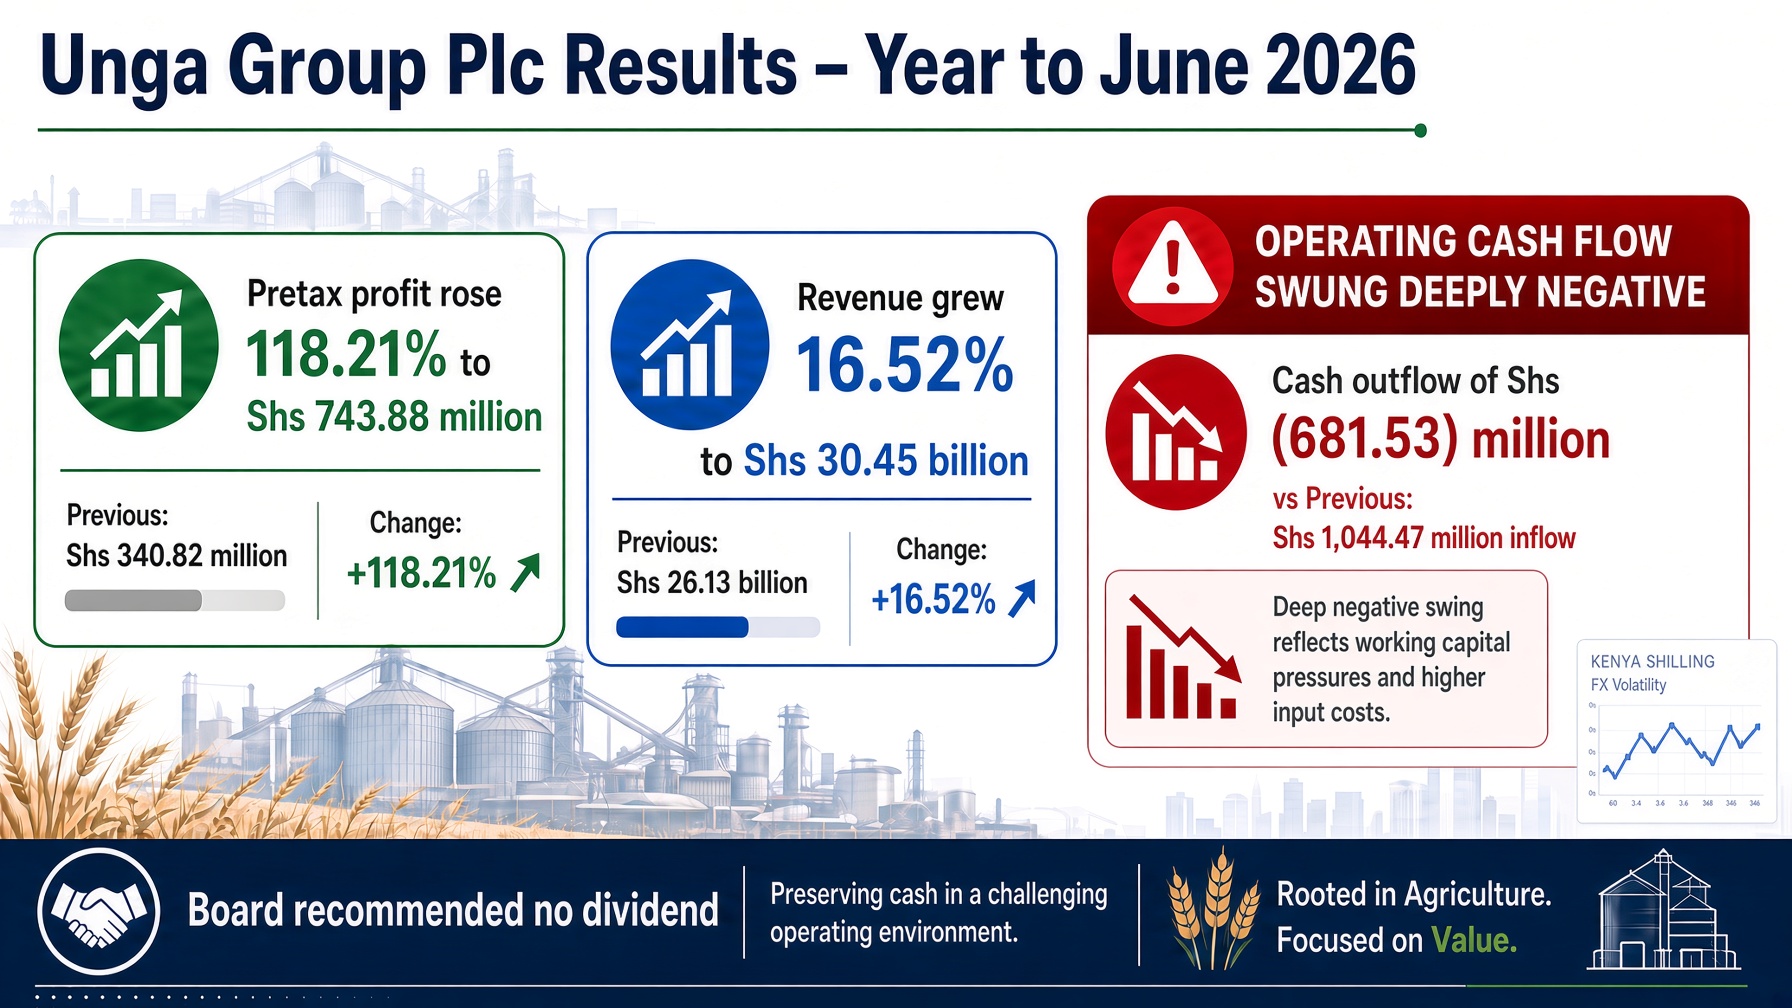
Unga Group pretax profit more than doubles in FY2026, declares no dividend
Unga Group Plc, the Nairobi Securities Exchange-listed animal and human nutrition group, reported pretax profit of Shs743.68 million for the year ended 30 June 2026, up 118.21 percent from Shs340.82 million a year earlier. Revenue grew 16.52 percent to Shs30.45 billion from Shs26.13 billion, and earnings per share rose 89.02 percent to Shs3.27 from Shs1.73. The board recommended no dividend for the year.
Revenue growth came from higher volumes in both the Animal Nutrition and Human Nutrition businesses, the group's two reporting segments. Animal Nutrition gained market share on expanded routes to market and deeper customer penetration. Human Nutrition also grew, though margins stayed under pressure from price-based competition and raw material cost volatility.
Unga Group Plc FY2025/26 Snapshot (Shs'000 unless stated)
| Metric | FY2026 | FY2025 | YoY Change |
|---|---|---|---|
| Revenue | 30,446,501 | 26,130,964 | +16.52% |
| Operating profit | 938,446 | 704,108 | +33.28% |
| Share of profit of associate | 62,934 | 29,199 | +115.53% |
| Finance income | 3,673 | 2,089 | +75.83% |
| Finance costs | (261,370) | (394,581) | -33.76% |
| Profit before tax | 743,683 | 340,815 | +118.21% |
| Income tax expense | (339,122) | (118,760) | +185.55% |
| Profit for the year | 404,561 | 222,055 | +82.19% |
| Attributable to owners of the parent | 247,862 | 131,328 | +88.74% |
| Attributable to non-controlling interests | 156,699 | 90,727 | +72.71% |
| Earnings per share (Shs) | 3.27 | 1.73 | +89.02% |
| Dividend per share (Shs) | 0.00 | n/a | n/a |
Source: Unga Group Plc audited consolidated results for the year ended 30 June 2026.
- To analyse Unga Group's reported numbers over the last four years, click here, or see the statements themselves on its financials view.
Finance costs fell 33.76 percent to Shs261.37 million from Shs394.58 million, as a more stable macroeconomic environment and steadier exchange rates eased the group's borrowing costs. That decline, combined with a 115.53 percent jump in Unga's share of profit from its associate company, pushed pretax profit up well ahead of the operating profit gain. Income tax expense rose even faster though, climbing 185.55 percent to Shs339.12 million as the effective tax rate increased to 45.60 percent from 34.85 percent. That higher tax bite is why profit for the year grew 82.19 percent, a slower pace than the 118.21 percent increase in profit before tax.
Total assets rose 36.56 percent to Shs15.13 billion from Shs11.08 billion, entirely on the back of current assets, which grew 70.55 percent to Shs9.99 billion. Non-current assets actually declined 1.51 percent to Shs5.15 billion. The current asset buildup points to inventory and receivables tied up in working capital, a pattern the cash flow statement confirms below.
Total equity grew just 6.89 percent to Shs5.70 billion, well behind the 82.19 percent rise in profit for the year. A Shs37.04 million other comprehensive loss, likely from foreign currency translation, trimmed total comprehensive income to Shs367.52 million. With no dividend paid and no new share capital issued, that figure is the entire increase in equity for the year.
Total liabilities rose 64.09 percent to Shs9.43 billion, almost entirely from current liabilities, which grew 68.74 percent to Shs9.02 billion. Non-current liabilities were little changed, up 2.97 percent to Shs418.38 million. The combination of assets growing on equity that barely moved pushed Unga Group's balance sheet markedly more leveraged, a shift the ratios below make explicit.
Unga Group's cash flow tells a starker story than the profit and loss account. Cash generated from operations swung to a Shs681.53 million outflow from a Shs1.04 billion inflow, and net cash from operating activities swung to a Shs1.48 billion outflow from a Shs655.94 million inflow, a reversal of Shs2.13 billion. The group attributed this to a deliberate build in working capital, undertaken to support higher sales volumes and to absorb supply chain and logistics disruptions affecting imported raw materials.
Net cash from financing activities swung the other way, to a Shs1.76 billion inflow from a Shs502.90 million outflow, a shift of Shs2.26 billion that points to fresh borrowing used to plug the operating cash gap. That borrowing is the direct counterpart to the leverage increase in the balance sheet above. Cash at the bank still rose 18.36 percent to Shs224.92 million, helped by a Shs36.97 million foreign exchange translation gain that offset the year's underlying cash shortfall.
- Whether Unga's operating cash covers its short-term bills is tracked on its liquidity view, alongside the operating cash flow ratio and current ratio.
Unga Group Plc FY2025/26 Key Ratios
| Ratio | FY2026 | FY2025 |
|---|---|---|
| Operating profit margin | 3.08% | 2.69% |
| Net profit margin | 1.33% | 0.85% |
| Effective tax rate | 45.60% | 34.85% |
| Return on assets (ROA) | 2.67% | 2.00% |
| Return on equity, total (ROE) | 7.10% | 4.16% |
| Return on equity, owners' share | 6.68% | 3.77% |
| Equity-to-assets ratio | 37.67% | 48.13% |
| Debt-to-equity ratio | 165.47% | 107.79% |
| Debt-to-assets ratio | 62.33% | 51.87% |
| Dividend payout ratio | 0.00% | n/a |
Source: ApexHub Insights calculations from Unga Group Plc's audited consolidated results for the year ended 30 June 2026.
Margins remain thin by any standard, typical of a high-volume, low-margin animal and human nutrition distributor, but both widened year on year. Operating margin reached 3.08 percent from 2.69 percent, and net margin rose to 1.33 percent from 0.85 percent, consistent with the cost discipline management described.
Return on equity improved to 7.10 percent from 4.16 percent on a blended basis, or 6.68 percent from 3.77 percent measured against owners' equity alone, after stripping out the roughly 35 percent of equity held by non-controlling interests. Part of that improvement came from genuinely higher profitability. Part of it reflects the balance sheet turning more leveraged, not from equity itself expanding.
The leverage shift is the clearest counterpoint to the profit headline. The equity-to-assets ratio fell to 37.67 percent from 48.13 percent, and debt-to-equity jumped to 165.47 percent from 107.79 percent, as liabilities grew nearly ten times faster than equity. None of the additional borrowing came through new share capital or retained earnings. It financed the working capital build instead, against a cash flow statement that turned negative for the year.
- Follow Unga Group's leverage trend on its solvency view, or compare it with other listed food and beverage companies on its peers view.
The board recommended no dividend for FY2026, a 0% payout and a decision management tied directly to the capital pressures above. "No dividend is recommended for the year, consistent with the priority of reinvesting in capacity and margin recovery," the company said. That framing lines up with a balance sheet that grew more leveraged and a cash flow statement that swung negative, even as the income statement posted its strongest profit growth in years.
- Unga Group's payout history sits on its dividend view. To track record dates and payment dates across the NSE, visit ApexHub Insights - Upcoming Dividends.
Management's outlook centers on converting this year's momentum into something more durable. The group said its priority is to "convert improved year-on-year momentum into sustainable, profitable and cash generating growth." It also flagged continued exposure to "global volatility in raw material supply chains, interest-rate and currency risks." Whether FY2026's profit growth survives a year of self-funded deleveraging, instead of one funded by fresh working-capital debt, is the question FY2027's results will answer.
Unga Group's results also illustrate a broader pattern across Kenya's agro-processing and animal feed sector. Much of that sector's raw material base is imported and exposed to the same supply chain disruptions and exchange rate swings the group flagged in its outlook. A profit recovery funded partly by short-term borrowing against imported raw material volatility carries different risk than one funded from internally generated cash. That distinction matters more as the cost of that borrowing moves with interest rates the group itself flagged as a risk.
Bottom line for investors: Unga Group's FY2026 headline numbers are genuinely strong. Pretax profit more than doubled, and EPS grew 89.02 percent. But the underlying cash story is weaker than the profit and loss account suggests. Operating cash flow went deeply negative, new borrowing plugged the gap, and leverage ratios moved sharply in the wrong direction. The improved operating and net margins are real and worth crediting, but investors weighing this stock on the headline profit growth alone would be missing the working-capital and leverage story sitting beneath it. No dividend was declared this year, so there is no near-term cash return to offset that risk.
Question or correction?
Spotted a figure that looks wrong, or want something in this note explained? It comes straight to us, and is not published.
Related research
- Kenya Pipeline Company Posts Kshs11.58 Billion Profit, 20% above IPO forecast
- Quickmart's Sole Shareholder to Sell 50% Stake in NSE Listing Set for September 30
- Quickmart Sets IPO Offer Price at KES7.50 a Share, Valuing the Company at KES30 Billion
- Umeme's Revenue Falls to Ushs4 Million in H1 2026 as Uganda Concession Winds Down
Run the numbers
- Income Tax Calculator
Run your own PAYE, reliefs and net pay on the current bands.
- Dividend Calendar
Every declared NSE dividend with its book closure and pay dates.
- Financial Planner
Goals, income, debt and net worth projected in one plan.
- Statement Analyzer
Turn bank statements into categorised income and expenses.