Kenya Pipeline Company (KPC) Exceeds IPO Prospectus Profit Forecast By 20%, Posts Kshs11.58 Billion Profit In First Results Since NSE Listing
Kenya Pipeline Company Plc exceeded its own IPO prospectus profit forecast by 20.45 percent in its first results as a listed company, posting profit after tax of Kshs11.58 billion for the year ended 30 June 2026, up 13.09 percent year on year. The board declared a maiden dividend of Kshs0.32 per share, a 3.56 percent yield on the Kshs9.00 offer price.
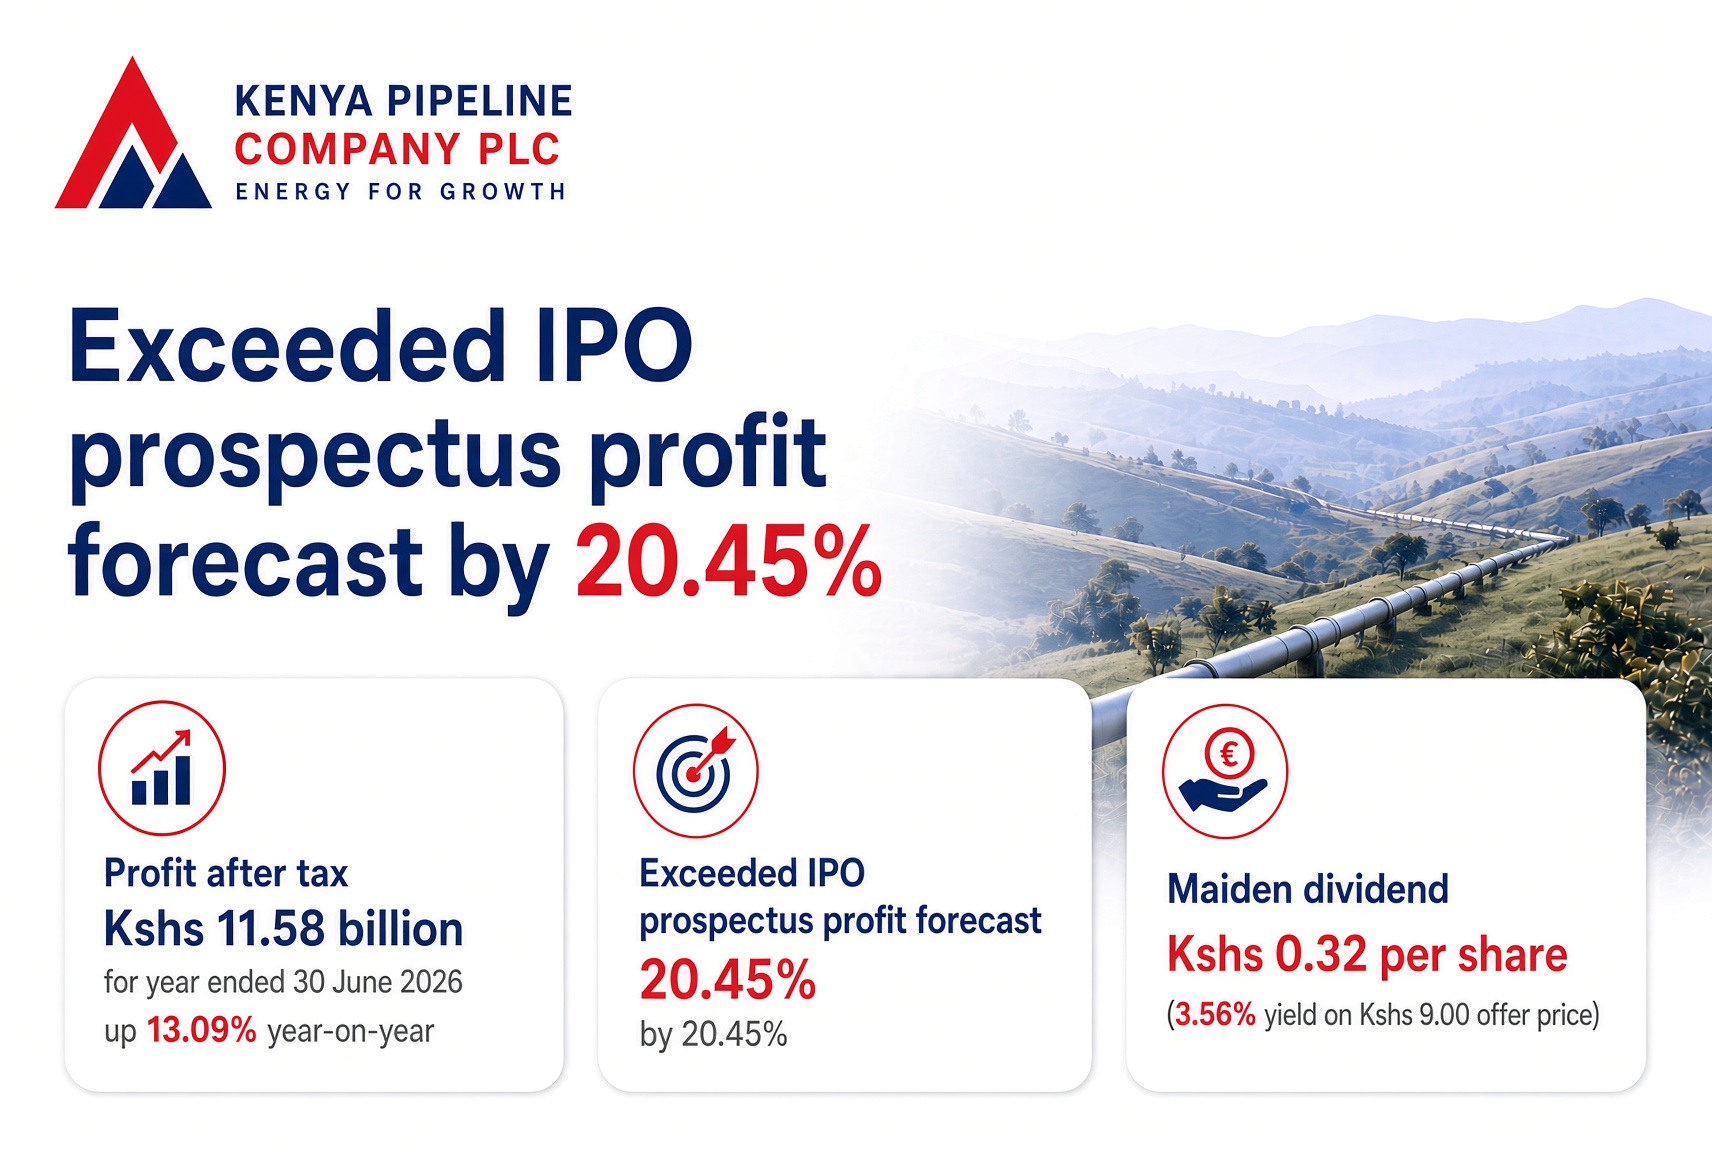
Kenya Pipeline Company exceeds IPO profit forecast by 20% in first results since NSE listing
Kenya Pipeline Company Plc (KPC) beat its own initial public offering prospectus profit forecast by 20.45 percent in the year ended 30 June 2026. These are the company's first results since converting from a wholly state-owned corporation into a listed public company on the Nairobi Securities Exchange. Profit after tax came in at Kshs11.58 billion, up 13.09 percent from Kshs10.24 billion a year earlier, well ahead of the Kshs9.62 billion the IPO prospectus had projected for the year. The board also declared a maiden first and final dividend of Kshs0.32 per share, Kshs5.9 billion in total, payable to shareholders on the register as at 30 November 2026.
That status matters for reading these numbers. KPC's own board called the year ahead its first full financial year as a listed public company. That means FY2025/26 captures the tail end of KPC's life as a wholly government-owned corporation and its transition onto the exchange, not a complete year under public markets' disclosure and governance standards.
Kenya Pipeline Company FY2026 Actual vs IPO Prospectus Forecast (Kshs millions)
| Line | Actual FY2026 | Prospectus FY2026 Forecast | Variance |
|---|---|---|---|
| Revenue from contracts with customers | 42,978.07 | 41,341.08 | 3.96% |
| Gross profit | 33,814.02 | 24,872.78 | 35.95% |
| Operating profit | 17,208.04 | 13,195.87 | 30.40% |
| Finance income/costs, net | 327.36 | 540.30 | -39.41% |
| Profit before income tax | 17,535.40 | 13,736.18 | 27.66% |
| Income tax expense | 5,953.48 | 4,120.85 | 44.47% |
| Profit for the year | 11,581.93 | 9,615.33 | 20.45% |
Source: Kenya Pipeline Company Limited IPO prospectus / information memorandum, "Prospective financial information," for the year ending 30 June 2026, compared against KPC's audited FY2026 results below.
Against its own IPO forecast, KPC's first year as a listed company came in well ahead. Revenue beat the prospectus's FY2026 forecast by 3.96 percent, gross profit by 35.95 percent, and operating profit by 30.40 percent, a wider margin than the revenue beat alone would suggest; the detailed cost picture follows below. Profit for the year beat the forecast by 20.45 percent. That came despite net finance income running 39.41 percent below what the prospectus modeled, and an effective tax rate of 33.95 percent, well above the 30.00 percent rate implicit in the forecast.
There is a more telling way to read that gap than a single year's beat.
Kenya Pipeline Company Actual FY2026 vs IPO Prospectus FY2027 and FY2028 Forecasts (Kshs millions)
| Line | Actual FY2026 | FY2027 Forecast | vs FY2027 | FY2028 Forecast | vs FY2028 |
|---|---|---|---|---|---|
| Revenue from contracts with customers | 42,978.07 | 44,835.87 | -4.14% | 52,342.30 | -17.89% |
| Gross profit | 33,814.02 | 26,930.75 | 25.56% | 32,192.40 | 5.04% |
| Operating profit | 17,208.04 | 14,644.93 | 17.50% | 19,088.24 | -9.85% |
| Profit for the year | 11,581.93 | 10,674.70 | 8.50% | 13,828.02 | -16.24% |
Source: Kenya Pipeline Company Limited IPO prospectus / information memorandum, "Prospective financial information," FY2027 and FY2028 columns, compared against KPC's actual FY2026 results. "vs FY2027" and "vs FY2028" are ApexHub Insights calculations, measuring how far actual FY2026 sits above or below each later year's forecast, not a year-on-year change.
Measured against the prospectus's later-year columns, not just FY2026, KPC's actual gross profit of Kshs33.81 billion already exceeds the FY2028 forecast of Kshs32.19 billion, by 5.04 percent. Actual operating profit and net profit already exceed the FY2027 forecast too, by 17.50 percent and 8.50 percent respectively. On profitability, KPC is running roughly one to two years ahead of its own IPO roadmap. Revenue tells a different story, actual FY2026 revenue still sits 4.14 percent below the FY2027 forecast, so the lead on profit comes from costs tracking below plan, not volumes running ahead of it. That gap says nothing about whether FY2027's actual results will beat FY2027's forecast too, a strong first year can reflect genuine operating momentum or one-off cost efficiencies that don't repeat.
That forecast deserves a caveat, too. ApexHub Insights flagged this in its own pre-listing valuation of the offer. PwC, the reporting accountant, expressed no opinion on the reasonableness of management's forecast assumptions, and said the forward-looking information could not yet be fully deemed a fair presentation under IFRS. Beating a forecast the reporting accountant declined to vouch for is a lower bar than beating audited guidance, even if the scale of the beat, especially at the operating and gross profit lines, is still a genuinely strong result.
At the Kshs9.00 offer price, actual FY2026 earnings per share of Kshs0.64 implies a trailing Price/Earnings multiple of about 14.06x. That's below the roughly 21.8x ApexHub flagged as rich against listed peers in its pre-listing valuation note, and closer to the peer median multiple of about 13.6x referenced there. Stronger-than-forecast earnings, not a falling share price, are what closed most of that gap. The Kshs0.32 dividend also works out to a 3.56 percent dividend yield on that same Kshs9.00 offer price, the first real income data point an investor who bought at listing has had to measure the offer against.
KPC shares closed at Kshs9.04 on 13 October 2026, the last session before today's results announcement, just 0.44 percent above the Kshs9.00 offer price. At that pre-announcement price, Kshs0.64 of FY2026 earnings per share implies a trailing Price/Earnings multiple of about 14.12x, and the Kshs0.32 dividend a 3.54 percent yield, both close to the offer-price figures above. How the market reacts to a 20.45 percent profit beat and a maiden dividend is still an open question, that verdict comes once trading resumes against the new numbers.
With that forecast comparison in view, here is how KPC's FY2026 actually stacks up against the year before.
Kenya Pipeline Company FY2025/26 Snapshot (Kshs millions)
| Line | FY2026 | FY2025 | YoY Change |
|---|---|---|---|
| Transport revenue | 41,821.36 | 38,593.63 | 8.36% |
| Total revenue | 42,978.07 | 39,502.17 | 8.80% |
| Direct costs | (9,164.05) | (8,444.83) | 8.52% |
| Gross margin | 33,814.02 | 31,057.34 | 8.88% |
| Operating expenses | (8,861.26) | (8,508.58) | 4.15% |
| EBITDA | 24,952.76 | 22,548.77 | 10.66% |
| Depreciation & amortisation | (7,744.72) | (6,441.26) | 20.24% |
| EBIT | 17,208.04 | 16,107.51 | 6.83% |
| Net finance income | 327.36 | 63.06 | 419.10% |
| Profit before tax | 17,535.40 | 16,170.57 | 8.44% |
| Income tax expense | (5,953.48) | (5,866.04) | 1.49% |
| Profit for the year | 11,581.93 | 10,241.47 | 13.09% |
| Earnings per share (Kshs) | 0.64 | n/a | n/a |
| Dividend per share (Kshs) | 0.32 | n/a | n/a |
| Total assets | 149,272.91 | 140,629.95 | 6.15% |
| Total equity | 119,328.07 | 107,920.41 | 10.57% |
| Total liabilities | 29,944.84 | 32,709.54 | -8.45% |
| Borrowings | 442.86 | 2,660.07 | -83.35% |
Source: Kenya Pipeline Company Plc, Consolidated Audited Financial Results FY 2025/26, for the year ended 30 June 2026. Total liabilities is an ApexHub Insights calculation, derived as total assets less total equity, for consistency with the balance sheet. FY2025 comparatives for earnings and dividend per share are not disclosed in this statement, reflecting KPC's transition from a wholly state-owned entity to a listed public company during the year.
Total revenue rose 8.80 percent to Kshs42.98 billion, built mainly on tariffs for moving and storing petroleum products through KPC's pipeline network. Transport revenue alone reached Kshs41.82 billion, up 8.36 percent and equal to 97.31 percent of the total, with the remaining Kshs1.16 billion coming from other income lines. KPC attributed the growth to higher local and transit volumes moving through the network, which the company said rose 7 percent over the year.
Direct costs rose 8.52 percent to Kshs9.16 billion, which KPC linked to higher maintenance and electricity costs. Operating expenses grew more slowly, up 4.15 percent to Kshs8.86 billion, keeping EBITDA growth of 10.66 percent to Kshs24.95 billion ahead of revenue growth. That gap lifted the EBITDA margin to 58.06 percent, from 57.08 percent a year earlier. Depreciation and amortisation jumped 20.24 percent to Kshs7.74 billion, though, a direct result of KPC's capital spending on pipeline and storage infrastructure. That faster depreciation growth pulled EBIT up only 6.83 percent to Kshs17.21 billion, below the pace set at the EBITDA line.
Total assets grew 6.15 percent to Kshs149.27 billion, which KPC linked mainly to a 3.24 percent rise in property, plant and equipment and a sharp increase in current assets, tied to capital projects aimed at operational efficiency. The company put the current assets increase at 30 percent and said cash balances alone rose 74 percent, on stronger collections, higher throughput and improved debt-recovery efforts. Total equity rose 10.57 percent to Kshs119.33 billion. Borrowings, meanwhile, collapsed 83.35 percent to just Kshs442.86 million, as KPC accelerated debt repayment, while net finance income swung to Kshs327.36 million from Kshs63.06 million a year earlier. That combination, falling debt and rising interest income, is the main reason net profit grew faster than operating profit.
Cash generated from operating activities rose 34.34 percent to Kshs17.39 billion, which KPC attributed to higher pipeline throughput revenue, improved collections and tighter working capital management. Net cash used in investing activities grew 77.50 percent to Kshs4.48 billion, reflecting the same infrastructure spending behind the jump in depreciation. Net cash used in financing activities narrowed 32.17 percent to Kshs3.50 billion, a smaller outflow now that most of the company's debt has already been repaid. Cash and cash equivalents closed the year at Kshs20.54 billion, up 84.45 percent.
Kenya Pipeline Company FY2025/26 Key Ratios
| Ratio | FY2026 | FY2025 |
|---|---|---|
| Gross profit margin | 78.68% | 78.62% |
| Operating profit margin | 40.04% | 40.78% |
| EBITDA margin | 58.06% | 57.08% |
| Net profit margin | 26.95% | 25.93% |
| Cost-to-income ratio | 49.11% | 48.14% |
| Return on Assets (ROA) | 7.76% | 7.28% |
| Return on Equity (ROE) | 9.71% | 9.49% |
| Equity-to-Assets ratio | 79.94% | 76.74% |
| Debt-to-Equity ratio | 25.09% | 30.31% |
| Debt-to-Asset ratio | 20.06% | 23.26% |
| Dividend payout ratio | 50.00% | n/a |
Source: ApexHub Insights calculations from KPC's Consolidated Audited Financial Results FY 2025/26. Operating profit margin uses EBIT (profit before net finance income and tax). Cost-to-income folds depreciation and amortisation in with operating expenses, so it moves differently from the narrower operating-expense growth discussed above. EBITDA margin is calculated directly from KPC's own disclosed EBITDA line. Debt ratios use total liabilities as "debt." Dividend payout ratio for FY2025 is not applicable, since no comparative dividend per share is disclosed.
The ratios tell two different cost stories. Narrow operating expenses grew only 4.15 percent against 8.80 percent revenue growth, which is why EBITDA margin expanded to 58.06 percent. But cost-to-income, which folds in depreciation, rose to 49.11 percent from 48.14 percent, because KPC's capital spending drove depreciation up 20.24 percent. The company is managing its controllable costs well, while its infrastructure investment is, for now, outrunning the earnings it has started generating below the EBITDA line.
Returns remain thin for a business this capital-intensive, which is typical of pipeline infrastructure with a large, long-lived asset base. Return on equity rose to 9.71 percent from 9.49 percent, and return on assets to 7.76 percent from 7.28 percent, both improving but still modest next to KPC's near Kshs150 billion balance sheet.
Leverage improved more decisively. Debt-to-equity fell to 25.09 percent from 30.31 percent, and debt-to-assets fell to 20.06 percent from 23.26 percent, as KPC used stronger cash generation to accelerate debt repayment. With just Kshs442.86 million in borrowings against Kshs20.54 billion in cash and cash equivalents at year-end, KPC now sits in a strong net cash position, a notable turnaround for a company only recently wholly state-owned.
The board recommended a first and final dividend of Kshs0.32 per share, Kshs5.9 billion in total, equal to exactly half of FY2026 earnings per share, which is consistent with its IPO's dividend policy commitment of 50% payout. The dividend is payable to shareholders on the register at the close of business on 30 November 2026, subject to shareholder approval.
Management frames the year ahead as the real first test of life as a listed company. The board said it wants to "ensure that the value created accrues equitably to the Government, to our new shareholders, and to the Kenyan public at large." It also pledged to keep investing in the safety, capacity and resilience of its regional pipeline and storage network.
KPC's listing is part of a broader Kenyan government push to privatise state corporations and widen the NSE's pool of listed companies, alongside Quickmart's IPO, beyond its traditional handful of large caps. A profitable, dividend-paying infrastructure monopoly broadens what is available to investors on a market where listings of this kind have been rare.
Bottom line for investors: this is KPC's first set of results and first dividend as a public company and it beat the company's own IPO forecast by 20.45 percent at the bottom line. Profit grew 13.09 percent year on year, driven as much by falling debt and lower finance costs as by operating performance, and the board's Kshs0.32 per share dividend returns exactly half of earnings to new shareholders. The case for holding rests on whether a near-debt-free balance sheet, a well-covered maiden dividend and a cheaper-than-at-listing earnings multiple outweigh still-thin, if improving, returns on a very large asset base, with heavier capital spending guided for the year ahead.
Question or correction?
Spotted a figure that looks wrong, or want something in this note explained? It comes straight to us, and is not published.
Related research
Run the numbers
- Dividend Calendar
Every declared NSE dividend with its book closure and pay dates.
- Valuation Workbench
Build the same kind of model this note works through.
- Financial Planner
Goals, income, debt and net worth projected in one plan.
- Statement Analyzer
Turn bank statements into categorised income and expenses.