Valuation models,built on the audited numbers.
Most valuation starts with an afternoon of typing figures out of an annual report into a spreadsheet. Ours starts with the figures already in. Pick an NSE-listed company, and the DCF, dividend discount and multiples models open populated with its audited annual accounts. What you supply is the part that is genuinely yours: the forecast, the margins and the cost of capital.
Seven models in one place. Every model needs a free sign-in so your assumptions are saved.
The only question valuation asks
What valuation is
Working out what a business is worth, without asking the market for the answer.
A company is worth the cash it will hand its owners over the rest of its life, discounted back to today because a shilling in 2034 is not a shilling now. That sentence is the whole of intrinsic valuation. Discounted cash flow applies it to the cash the firm generates; the dividend discount model applies it to the cash that actually reaches the shareholder.
Relative valuation asks a different question: not what the business is worth in the abstract, but what the market is currently paying for a shilling of earnings, book value or EBITDA elsewhere in the sector. It is faster, it is honest about being an opinion poll, and it is the reason a good analyst runs both.
The number at the end matters less than you would think. What you keep is the chain of assumptions that produced it, because that is what you revisit when results come out and something has moved.
Price is what the market thinks. Value is what you can defend.
A share price is a vote counted every second by people with different horizons and different information. A valuation is a number you can explain line by line. When the two disagree, the interesting question is which of your assumptions the market is not sharing.
The assumptions are the analysis
Nobody gets the terminal growth rate right. What a model buys you is the discipline of writing down a growth path, a margin and a cost of capital, then seeing what price they imply. If a stock only works at 15 percent growth forever, you have learned something.
It tells you what you are being paid to take
The gap between value and price is the margin of safety, the room you have to be partly wrong and still do fine. Position sizing without it is guessing, and a thin margin on a great business is often a worse deal than a wide one on an ordinary business.
It survives the story
Narratives around a listed company change quickly. Audited cash flows, dividend history and book equity change slowly. Anchoring to the accounts is what stops a valuation from becoming an argument you already wanted to win.
Intrinsic value, Nairobi Securities Exchange
Three models, prepopulated with audited accounts
Each of these opens with the company's published annual figures already loaded from the same financial statement feed the screener and industry pages use. You update the forward-looking inputs, and only those.
Discounted Cash Flow
Value the whole firm from the free cash flow it throws off, then bridge to equity by taking out net debt. The workhorse for non-financials.
- Audited revenue, margins, capex and working capital already loaded
- You set the forecast horizon, growth path and terminal assumption
- WACC built from your cost of equity, cost of debt and capital structure
- Sensitivity across growth and discount rate, so you see the range not a point
Dividend Discount Model
For the banks, insurers and steady payers that dominate the NSE, where dividends are the cash the shareholder actually receives.
- Declared dividend history and payout ratios prepopulated
- Gordon growth and multi-stage variants on the same inputs
- Retention and return on equity implied growth, cross-checked against payout
- Works where free cash flow does not, which is most of the financial sector
Relative Valuation
What comparable companies are changing hands at. The fastest sanity check on a DCF, and often the first number a market will move to.
- P/E, P/B, EV/EBITDA and EV/Sales computed from the same audited feed
- Sector and peer-group medians built from the NSE universe
- Implied price per share at peer, sector and your own target multiple
- Reconciles against the intrinsic models rather than replacing them
Why the discount rate does most of the work
Value is dominated by cash flows far enough out that nobody can forecast them, which is exactly why the rate you discount them at matters more than the forecast itself. Move a cost of capital by two points and a valuation can move by a third. Every model here builds the rate from its components, risk-free rate, equity risk premium, beta and after-tax cost of debt, so the assumption is visible rather than buried.
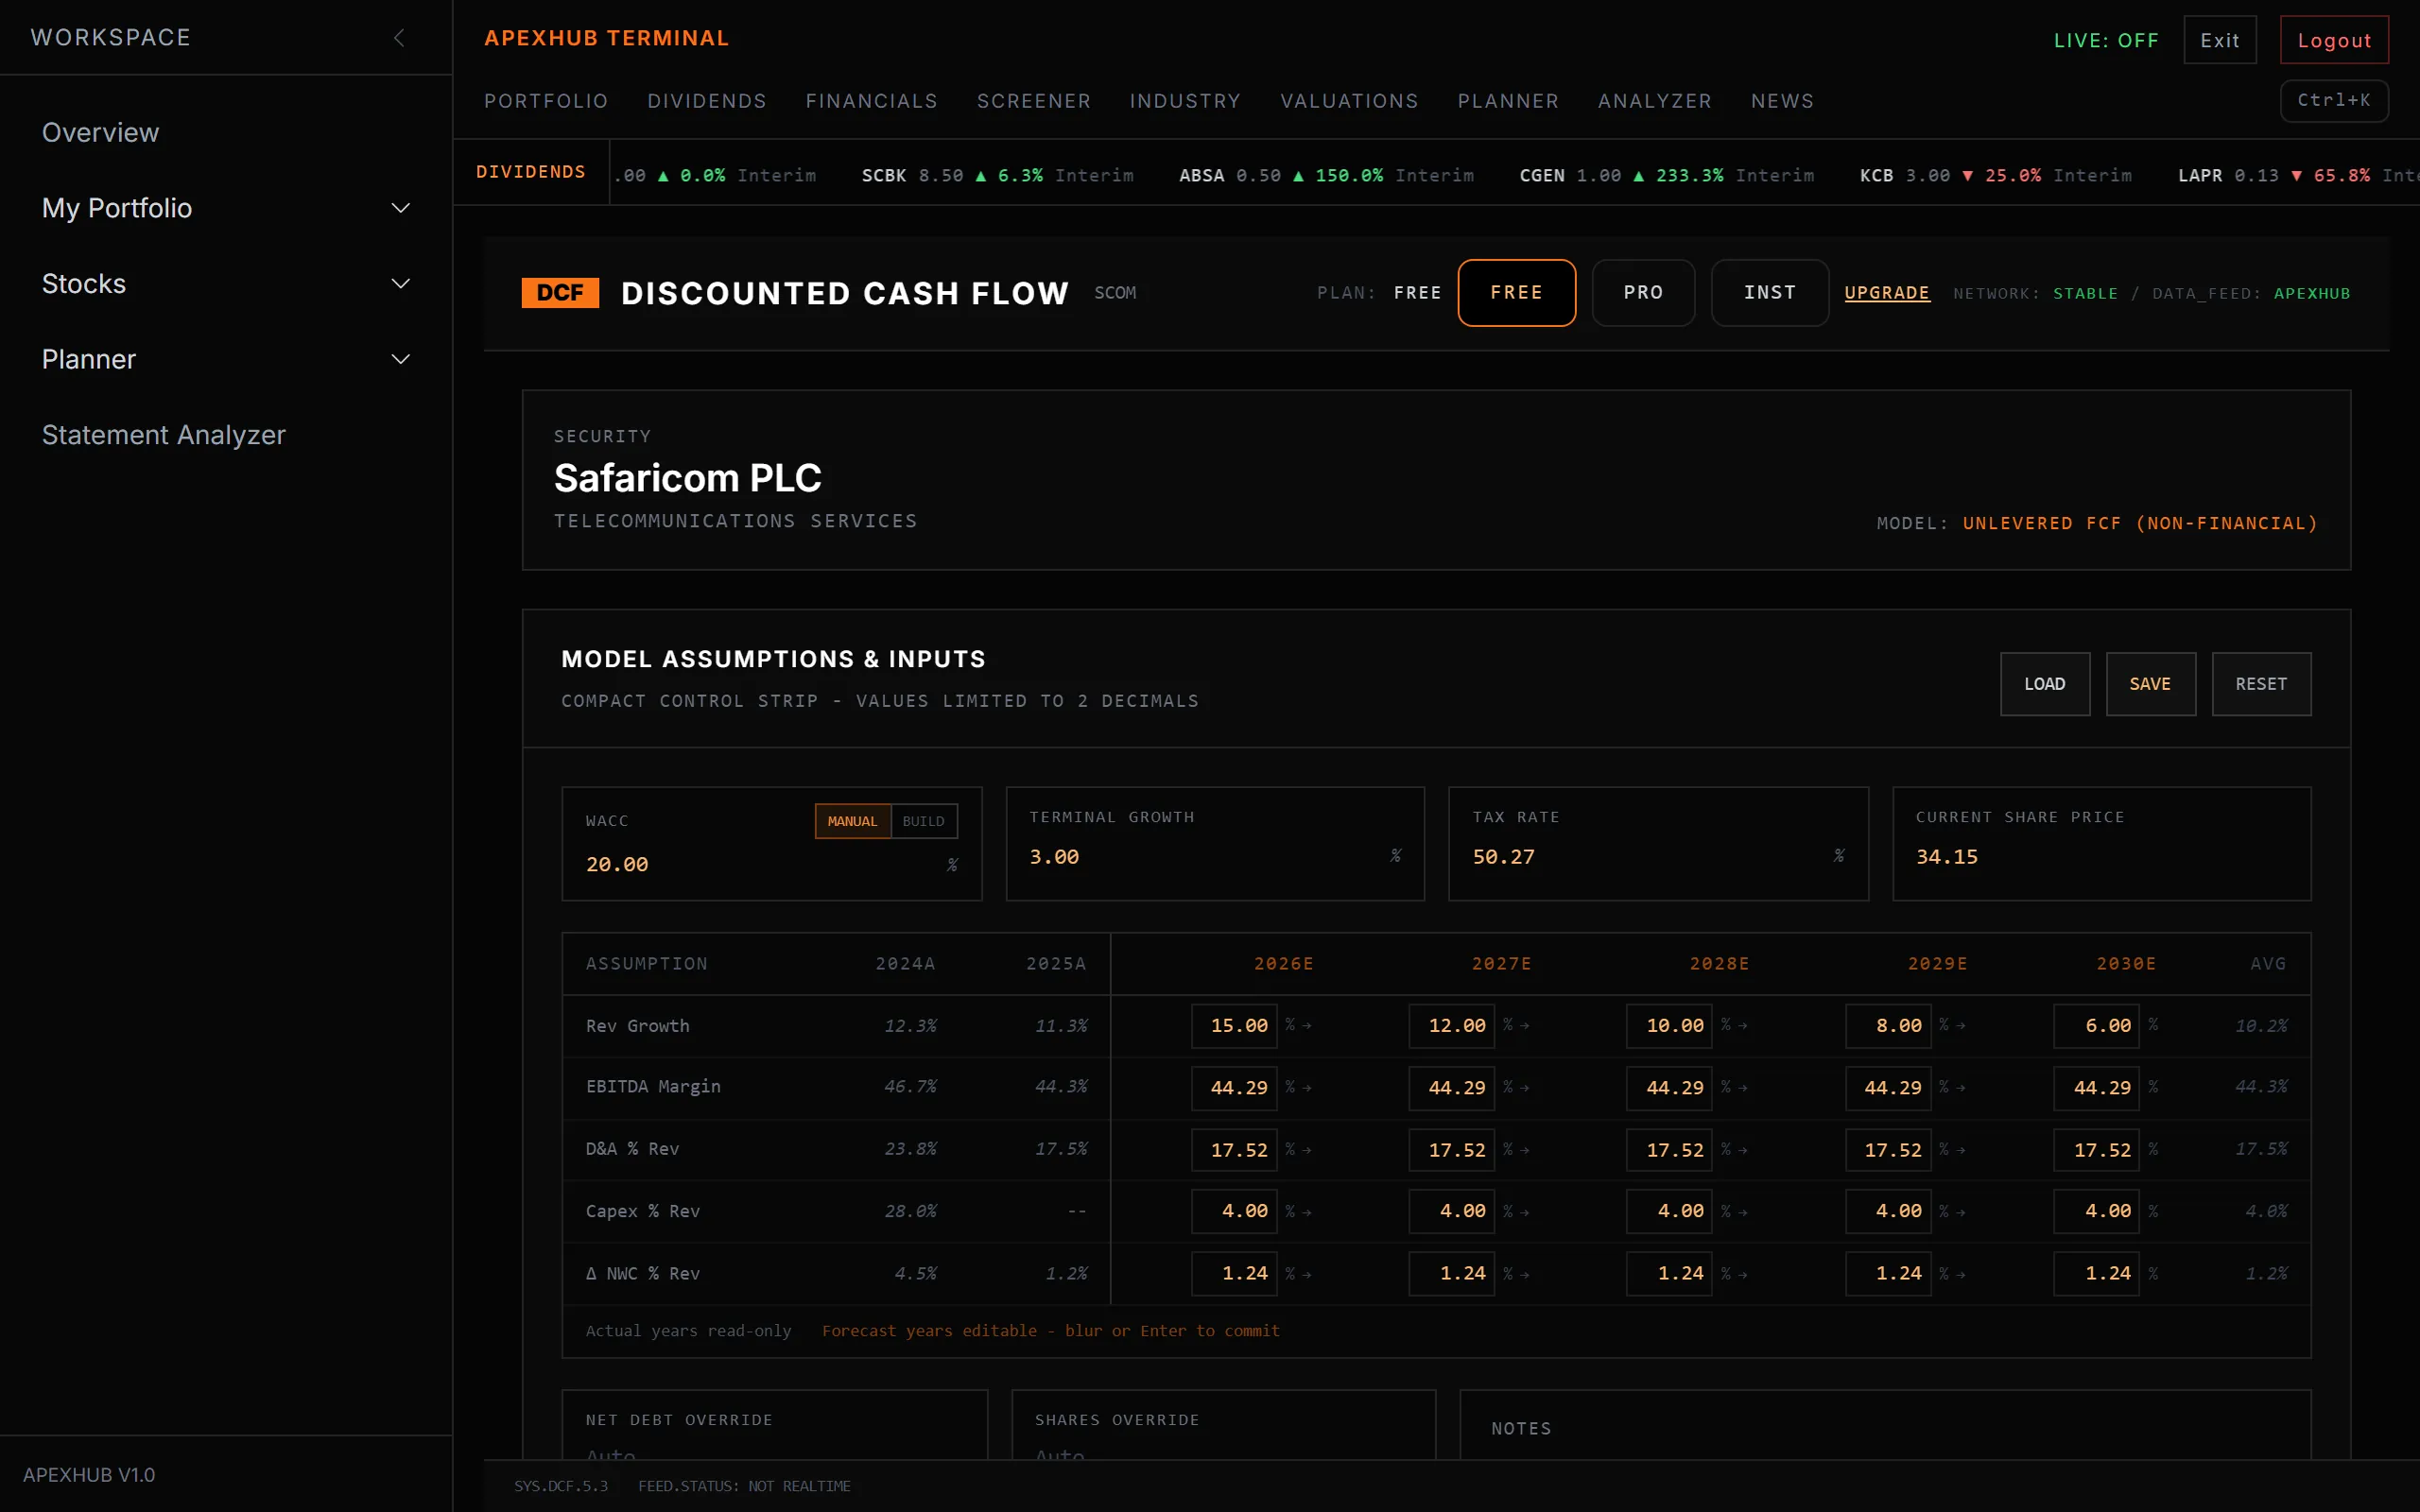
Discounted cash flow · published accounts loaded, the forecast left to you
Market and portfolio models
Live US prices, or a series you bring
These four work on returns rather than accounts, so they are not tied to one exchange. Point them at live US tickers or upload a CSV of your own price history, including NSE data you already hold.
Event Study
Did the announcement actually move the stock, or was it just the market? Measures abnormal return against a market model estimated before the event.
- Estimation window, event window and market benchmark all configurable
- Abnormal returns, cumulative abnormal returns and significance tests
- Confounding-event flags, so a result is not quietly another story
- Live US tickers or your own price series
Portfolio Optimisation
Mean-variance allocation on your candidate assets. Finds the weights with the best return per unit of risk instead of splitting evenly and hoping.
- Efficient frontier, minimum variance and maximum Sharpe portfolios
- Position limits and fixed weights where a holding is not up for debate
- Correlation matrix, so you can see which assets are diversifying anything
- Live US tickers or a CSV of your own returns
Portfolio Optimisation V2
The same problem with better tools. Adds downside risk, because an investor who is happy with upside volatility should not be penalised for it.
- Sharpe, Sortino and a hybrid objective, compared side by side
- Daily through annual frequencies with an explicit risk-free series
- Global efficient weights and the full frontier, charted
- Live US tickers or a CSV of your own returns
Multi-Strategy Backtest
Combine momentum, trend following, risk parity and volatility control into one allocation, then walk it forward to see how it would have held up.
- Momentum, risk parity, trend following and volatility-controlled sleeves
- Combination strategies with walk-forward rebalancing
- Point-in-time eligibility, so a stock is never traded before it listed
- Strategy comparison on the same return series and the same window
Weights, not just picks
Optimisation finds the mix with the highest return per unit of risk, which is almost never the equal split people default to. The frontier shows what you give up for every notch of risk you refuse to take.
Did the news actually move it?
A stock rising 4 percent on results day means little if the whole market rose 4 percent. An event study estimates normal behaviour before the announcement, then measures only the excess in the window around it.
Choosing a model
Start from the question, not the tool
A profitable non-financial with real capex
Manufacturers, telcos, energy, retail. Cash flow is the cleanest signal.
A bank, insurer or reliable dividend payer
Free cash flow is not meaningful for a balance-sheet business. The dividend is.
You need a second opinion, fast
Peer multiples in minutes. Best used to challenge a DCF, not to replace it.
A results release, rights issue or profit warning just landed
Separates the market move from the company move over the event window.
You have picks and now need weights
Valuation says what to own. Optimisation says how much of each.
You want a rules-based allocation, not a stock pick
Momentum, trend and risk parity combined, then walked forward.
How a valuation runs here
Four steps, and none of them is data entry
Pick the company, not a blank model
Choose an NSE listing from the directory and the model opens already populated with its audited annual accounts. No transcribing figures out of a PDF, and no spreadsheet to build first.
Replace our assumptions with yours
The prepopulated forecast is a starting point, not a house view. Change the growth path, the margins, the forecast horizon, the cost of equity and the capital structure until the model reflects what you actually believe.
Read the range, not the point
Sensitivity tables show what the value does across growth and discount rate together. A valuation that only holds at one corner of that grid is telling you how fragile the thesis is.
Cross-check, then size the position
Test the intrinsic number against peer multiples, and if there is a gap, find out which assumption creates it. Then take the names that survive into portfolio optimisation and decide the weights.
Before and after
Valuation is the middle of the job
You need candidates before you can value anything, and a plan afterwards to know how much of your net worth belongs in equities at all. The rest of the platform covers both ends.
Before
Find the candidates
Screen the NSE on the same financial statement feed these models use, and read the industry ratios in context.
Alongside
Track what you own
Once the weights are set, follow the holdings and the dividend income they generate through the year.
After
Fit it into a plan
A valuation tells you what a share is worth. A plan tells you whether you should be buying it at all this year.
Common questions
Valuation FAQ
What is valuation?
Valuation is estimating what an asset is worth on its own merits, independent of the price currently quoted for it. For a listed company that usually means discounting the cash it is expected to generate back to today, or comparing it to what similar companies trade at. The output is an intrinsic value per share you can compare against the market price.
Why is valuation important?
Because price alone tells you nothing about whether something is cheap. Valuation forces you to write down the growth, margins and cost of capital your purchase implies, which turns an opinion into a set of testable assumptions. The gap between your value and the market price is your margin of safety, and it is what you are actually being paid for taking the risk.
Which valuation model should I use?
Use discounted cash flow for profitable non-financial companies with real capital expenditure. Use the dividend discount model for banks, insurers and steady dividend payers, where free cash flow is not a meaningful concept. Use relative valuation as a cross-check on either. Most serious work uses at least two and investigates the difference.
Do I have to enter the financial statements myself?
No. The DCF, dividend discount and relative valuation models for NSE-listed companies come prepopulated with audited annual figures. You update the forward-looking inputs, growth, margins, forecast horizon and cost of capital, which are the parts that are genuinely yours to decide.
Can I value US stocks or my own data?
Yes, for the market models. The event study, both portfolio optimisers and the multi-strategy backtest run on live US tickers or on a return series you upload as a CSV. The three intrinsic-value models are built on the NSE financial statement feed and are Kenya-specific.
What discount rate should I use?
For equity, a cost of equity built from a risk-free rate, an equity risk premium and a beta for the business. For a whole-firm DCF, blend that with the after-tax cost of debt at the company target capital structure. The tools let you set each component rather than typing one number, so the rate is auditable.
Are these valuation tools free?
The models are free to use with a free sign-in, which is what lets your saved assumptions persist between visits. Portfolio optimisation and the multi-strategy backtest are also available on the public pages without an account.
Pick a company and change one assumption.
It is the fastest way to see what a model is really sensitive to. The accounts are already loaded, so you can be looking at an intrinsic value in under a minute.
Backtests, walk-forward models, and projections shown here are experimental mathematical tools applied to historical public disclosures, for quantitative research and educational purposes only. Historical model accuracy does not guarantee future results, and the outputs are not forecasts, valuation guarantees, price targets, or solicitations to trade.
Outputs are built from user-supplied inputs and historical disclosures. Nothing here is an offer, solicitation, or personalized recommendation to buy, sell, or trade any security, financial instrument, or insurance product, or a substitute for professional financial, tax, legal, or estate planning advice.