Kenya Power Operating Costs Jump 26.71 Percent To Sh53.75 Billion In FY2026
Kenya Power's operating costs jumped 26.71 percent to Sh53.75 billion in FY2026, more than three times the pace of revenue growth, even as profit after tax rose 2.13 percent to Sh24.99 billion and the dividend rose 50 percent to Sh1.50.
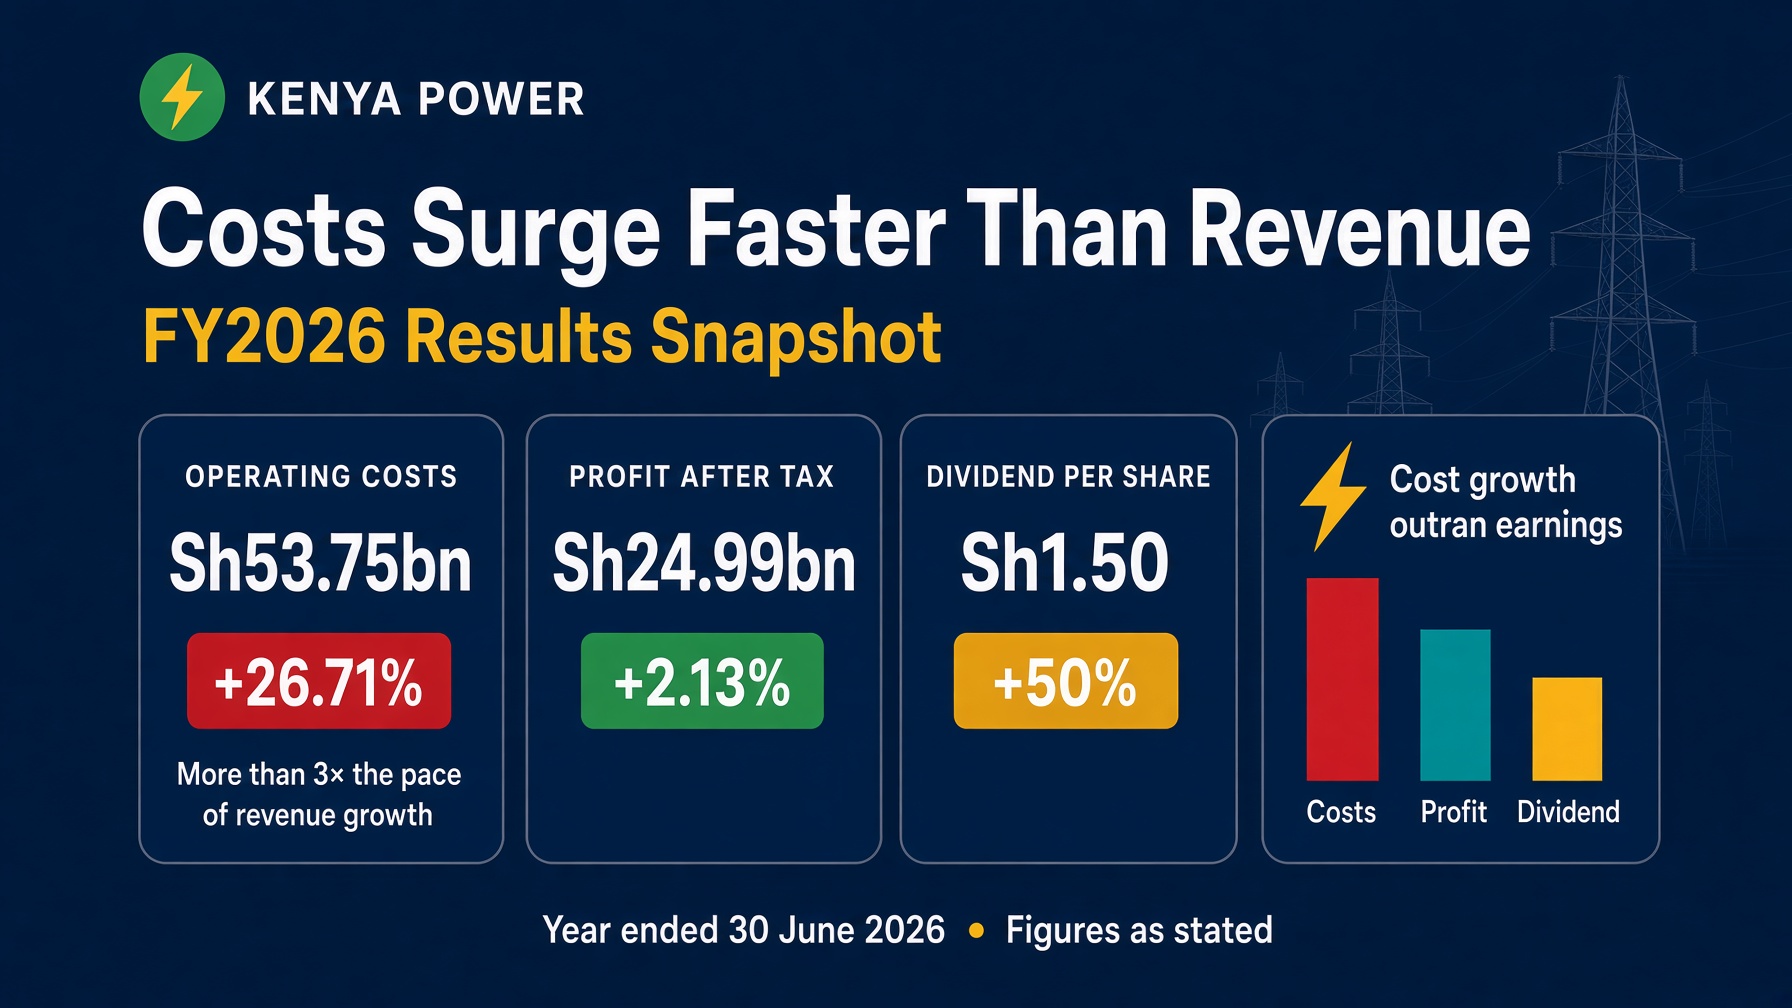
Kenya Power operating costs jump 26.71 percent to Sh53.75 billion in FY2026, outpacing revenue growth
Kenya Power's operating costs jumped 26.71 percent to Sh53.75 billion in the year to 30 June 2026, more than three times the 8.64 percent pace of revenue growth. Profit after tax still rose 2.13 percent, to Sh24.99 billion (KPLC, FY2026 results announcement). Profit before tax rose a slower 1.81 percent, to Sh36.01 billion, as operating costs alone added Sh11.33 billion during the year. Basic and diluted earnings per share edged up, from Sh12.64 to Sh12.81, a rise of 1.34 percent.
Kenya Power FY2026 Snapshot (KShs millions)
| Line item | FY2026 | YoY Change | FY2025 |
|---|---|---|---|
| Revenue from contracts with customers | 238,240 | 8.64% | 219,285 |
| Cost of sales | (152,647) | 5.52% | (144,664) |
| Gross profit | 85,593 | 14.70% | 74,621 |
| Other income | 6,724 | -7.47% | 7,267 |
| Operating costs | (53,750) | 26.71% | (42,421) |
| Operating profit | 38,567 | -2.28% | 39,467 |
| Interest income | 528 | -15.52% | 625 |
| Finance costs | (3,081) | -34.68% | (4,717) |
| Profit before tax | 36,014 | 1.81% | 35,375 |
| Income tax expense | (11,025) | 1.07% | (10,908) |
| Profit after tax | 24,989 | 2.13% | 24,467 |
| Total assets | 421,485 | 8.34% | 389,038 |
| Total equity | 131,801 | 20.55% | 109,335 |
| Total liabilities | 289,684 | 3.57% | 279,703 |
| Dividend per share (Kshs) | 1.50 | 50.00% | 1.00 |
| Basic and diluted EPS (Kshs) | 12.81 | 1.34% | 12.64 |
Source: KPLC, Audited Financial Results for the Year Ended 30 June 2026. Total liabilities derived as total assets minus total equity. FY2025 dividend per share from ApexHub Insights' dividend tracker.
Electricity sales rose 12 percent, to 12,777 gigawatt-hours, as the Company added 411,710 new customers. That lifted electricity revenue by Sh18.96 billion, to Sh238.24 billion. Meanwhile, distribution and transmission efficiency improved from 78.79 percent to 81.42 percent, a gain of 2.63 percentage points, letting more of that demand convert into billed sales. Cost of sales, in turn, rose a slower 5.52 percent, to Sh152.65 billion, trailing revenue growth.
That gap between cost of sales and revenue growth added Sh10.97 billion to gross profit, which reached Sh85.59 billion. Consequently, gross margin rose from 34 percent to 36 percent, a gain of 2 percentage points. Operating costs, though, grew far faster: up 26.71 percent, more than three times the pace of revenue. For its part, management blames higher expected credit losses, staff costs, depreciation and other expenses, saying the increase reflects "the resources required to operate, maintain and expand the electricity network, while continuing to support customer service and business operations."
That explanation deserves some scepticism. A cost base growing three times faster than revenue is not obviously proportionate to 411,710 new customers. And management has not said how much of the Sh11.33 billion increase came from credit losses specifically, the figure worth watching most given how much of that new customer base is actually paying its bills.
Finance costs, by contrast, fell Sh1.64 billion, to Sh3.08 billion, as KPLC's loan balance shrank. The Central Bank of Kenya cut its benchmark rate to 8.75 percent in February 2026, then held it there through three meetings since. With the CBR now flat, KPLC's own debt paydown, borrowings down to Sh79.82 billion, is doing the work, not further rate relief.
That domestic pause now sits alongside a shift abroad. The US Federal Reserve, meanwhile, raised its own benchmark rate by 25 basis points on 16 September 2026, to a range of 3.75 to 4.00 percent, its first hike since 2023, narrowing the rate gap that has helped keep Kenyan assets attractive to foreign investors (US Federal Reserve). At home, Kenya's 12-month inflation has also been climbing, from 4.25 percent in February to 6.59 percent in August, a rise of 2.34 percentage points, still inside the Central Bank of Kenya's 2.5 to 7.5 percent target band but trending toward its upper half (Central Bank of Kenya). Both trends point the same way: room for further CBK cuts looks narrower than it did earlier in the year, which matters for a capital-intensive borrower like KPLC counting on cheaper debt ahead.
Total assets grew Sh32.45 billion, to Sh421.49 billion, funded partly by Sh28 billion of capital expenditure. Working capital swung from negative Sh19.21 billion to positive Sh1.90 billion, an improvement of Sh21.11 billion, lifting the current ratio from 0.84 to 1.02, up 0.18. Total borrowings fell to Sh79.82 billion, with the portion due within a year down 39.21 percent, to Sh10.64 billion. Total equity, meanwhile, rose Sh22.47 billion, or 20.55 percent, to Sh131.80 billion, as gearing improved from 73 percent to 55 percent, down 18 percentage points, and debt-to-equity, on KPLC's own borrowings basis, from 0.80 to 0.60, a drop of 0.20.
Kenya Power FY2026 Key Ratios
| Ratio | FY2026 | FY2025 |
|---|---|---|
| Gross margin | 35.93% | 34.03% |
| Operating margin | 16.19% | 18.00% |
| Net margin | 10.49% | 11.16% |
| Cost-to-income (operating costs / gross profit) | 62.80% | 56.85% |
| Return on assets (ROA) | 5.93% | 6.29% |
| Return on equity (ROE) | 18.96% | 22.38% |
| Equity-to-assets | 31.27% | 28.10% |
| Debt-to-equity (total liabilities / equity) | 2.20x | 2.56x |
| Debt-to-asset (total liabilities / assets) | 68.73% | 71.90% |
| Dividend payout ratio | 11.71% | 7.91% |
Source: ApexHub calculations from KPLC's FY2026 published results. Debt-to-equity and debt-to-asset here use total liabilities as "debt", distinct from KPLC's own borrowings-based gearing and debt-to-equity figures quoted above.
Gross margin expanded, but cost-to-income worsened from 56.85 percent to 62.80 percent, up 5.95 percentage points, pulling net margin down from 11.16 percent to 10.49 percent, a drop of 0.67 percentage points. Returns thinned as a result: ROE fell from 22.38 percent to 18.96 percent, down 3.42 percentage points, and ROA from 6.29 percent to 5.93 percent, down 0.36 percentage points. Leverage, though, kept improving, with equity-to-assets rising from 28.10 percent to 31.27 percent, up 3.17 percentage points, and debt-to-asset falling from 71.90 percent to 68.73 percent, down 3.17 percentage points.
- To analyse KPLC's reported numbers over the last four years, click here, or follow the leverage trend on its solvency view and the statements themselves on its financials view.
KPLC paid an interim dividend of Sh0.30 during the year and has proposed a final of Sh1.20, taking FY2026's total to Sh1.50. That is up 50 percent from Sh1.00 in FY2025 (Sh0.80 final plus Sh0.20 interim). The payout ratio rises to 11.71 percent from 7.91 percent, a gain of 3.80 percentage points. That final dividend, though, is proposed, not paid: it needs shareholder approval before it is payable, to shareholders on the register at close of business on 27 December 2026, with payment due before 31 December 2026.
- KPLC's payout history sits on its dividend view. To track record dates and payment dates across the NSE, visit ApexHub Insights - Upcoming Dividends.
KenGen, the other listed half of the sector, went the other way for the same year, cutting its payout to Sh0.75 from Sh0.90 as capital spending took priority. Two utilities reporting to 30 June 2026, two opposite dividend decisions.
One further point on the stock rather than the accounts: KPLC was a statistically significant positive performer around both the 2017 and 2022 general elections, the only NSE counter to manage that in both cycles, a tariff and capital-allocation sensitivity that FY2027 will run into ahead of the 2027 vote.
Bottom line for investors: Profit after tax rose 2.13 percent to Sh24.99 billion, and the dividend rose 50 percent to Sh1.50 a share. But returns are thinning, ROE down from 22.38 percent to 18.96 percent, as operating costs outrun revenue. Holders are being paid more from a stronger balance sheet, but the cost line is worth watching into FY2027.
Question or correction?
Spotted a figure that looks wrong, or want something in this note explained? It comes straight to us, and is not published.
Related research
- How Kenyan Elections Move the NSE: An Event Study Across 2017 and 2022
- KPLC’s Underlying Strength Exposed: Efficiency Gains and Debt Reduction Offset 18.66% Profit Dip
- Diamond Trust Bank Posts 13% Pre-Tax Core Profit Growth Despite Decline in Non-Interest Income in H1 2025
- EABL's Strong FY25 Financial Performance Fuels Significant Dividend Increase to KShs 8.00 Per Share
Run the numbers
- Industry Analysis
Sector-level ratios for every listed company we cover.
- Financial Planner
Goals, income, debt and net worth projected in one plan.
- Statement Analyzer
Turn bank statements into categorised income and expenses.
- Stock Screener
Screen the NSE on the same fundamentals this note is built on.