How Often Should You Rebalance? What ApexHub's Walk-Forward Study Found
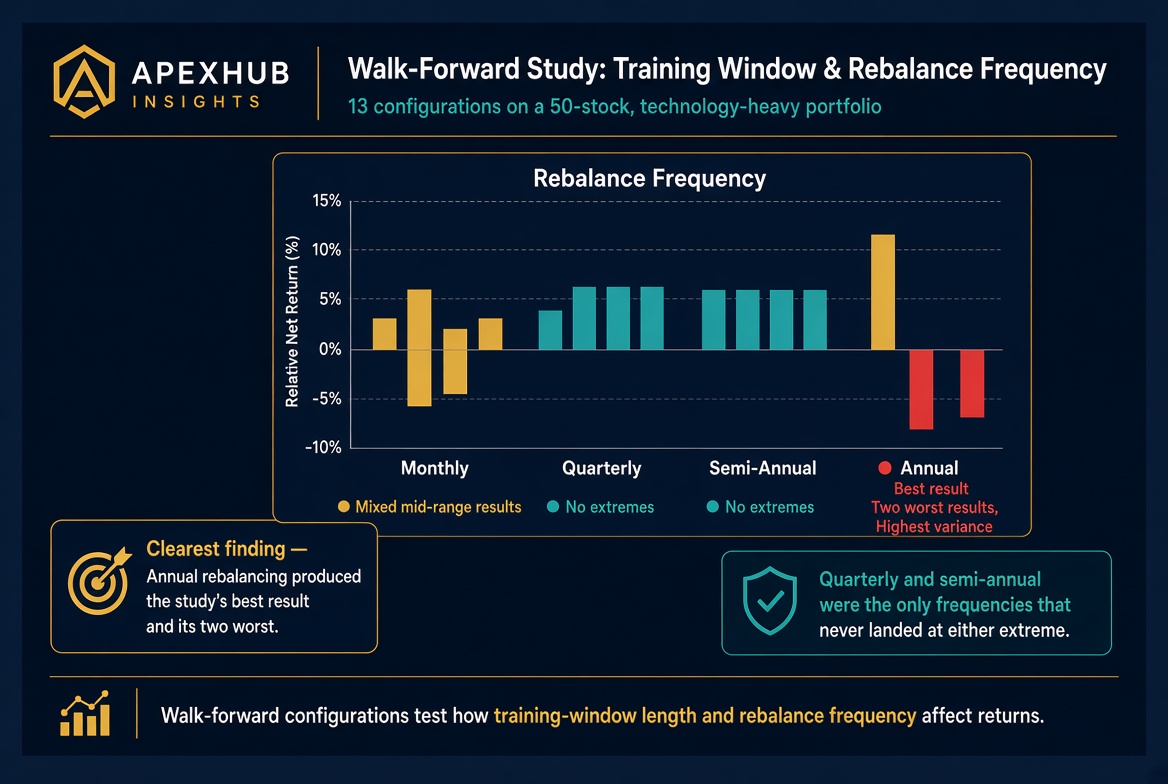
ApexHub Insights ran 13 walk-forward configurations on a 50-stock, technology-heavy portfolio to test how training window length and rebalance frequency affect returns. The clearest finding, annual rebalancing produced the study's best result and its two worst, while quarterly and semi-annual rebalancing were the only frequencies that never landed at either extreme.
How often should you rebalance your stock portfolio? ApexHub tested 13 strategies to find out
Say you have picked fifty stocks you believe in and put your money behind them. The harder question comes next, how much of each name should you hold, and how often should you revisit that split. Most investors answer with a guess, or a convention borrowed from somewhere else, because there has been no real way to test the choice against actual outcomes.
ApexHub Insights ran that test directly. Using its own walk-forward backtester, the platform built 13 configurations on a 50-stock, technology-heavy universe of large-cap U.S. equities, and tracked what each one would have actually returned between October 2021 and September 2026.
Twelve of those configurations were tested walk-forward, meaning the tool re-optimised the portfolio at each rebalance using only the data that would have been available at that point in time. It never got a peek at what came after. The thirteenth was an in-sample reference case, given the entire period's data upfront, which exists only to show a ceiling no real strategy could ever reach.
What the study actually varied
Two design choices were tested at every combination. The training window is how many months of trailing history the optimiser looks at when estimating each stock's risk and return. The rebalance frequency is how often the portfolio gets reset to the optimiser's new targets.
Everything else stayed fixed across every run: the 50-stock universe, a 25 percent cap per position, a $10,000 starting balance with $10,000 a month in ongoing contributions, and real management fees and trading costs. That held the training window and rebalance frequency as the only two variables actually under test.
How often should you rebalance?
Quarterly and Semi-Annual rebalancing were this study's steadiest performers. Across all three training windows tested, neither was ever the single best result, but neither was ever the worst either. That consistency is exactly what an investor building a real strategy needs, more than a single flashy number.
Annual rebalancing is the frequency that complicates the picture. It produced this study's single best outcome at the 12-month training window, up 211.0 percent with a Sharpe ratio of 1.61. Sharpe ratio measures return earned per unit of risk taken, so a higher number means more return for the same volatility. But that same Annual rule produced the worst outcome at both other training windows tested, on a very small sample of only two to four rebalances each.
At a glance: what each configuration returned
| Configuration | Rebalances | Total Return (Optimized) | Total Return (Equal-Weight) | Sharpe (Optimized) | Sharpe (Equal-Weight) |
|---|---|---|---|---|---|
| In-sample reference (ceiling) | 0 | +942.8% | +128.1% | 1.49 | 0.64 |
| 12-month / Monthly | 48 | +83.2% | +82.6% | 0.97 | 1.24 |
| 12-month / Quarterly | 16 | +93.8% | +87.3% | 1.08 | 1.27 |
| 12-month / Semi-Annual | 8 | +140.7% | +80.0% | 1.47 | 1.21 |
| 12-month / Annual | 4 | +211.0% | +86.3% | 1.61 | 1.21 |
| 24-month / Monthly | 36 | +75.1% | +50.9% | 1.26 | 1.18 |
| 24-month / Quarterly | 12 | +82.9% | +54.8% | 1.27 | 1.22 |
| 24-month / Semi-Annual | 6 | +88.5% | +49.0% | 1.33 | 1.14 |
| 24-month / Annual | 3 | +60.7% | +53.3% | 1.12 | 1.14 |
| 36-month / Monthly | 24 | +23.3% | +31.0% | 0.68 | 0.98 |
| 36-month / Quarterly | 8 | +22.0% | +33.8% | 0.70 | 1.04 |
| 36-month / Semi-Annual | 4 | +22.2% | +28.8% | 0.66 | 0.95 |
| 36-month / Annual | 2 | +6.3% | +31.1% | 0.50 | 0.95 |
Source: ApexHub Insights, Portfolio Optimisation Walk-Forward Study, 3 September 2026. All 12 walk-forward configurations verified against the tool's Run History and Rebalance Log exports.
Why did Annual rebalancing win once and lose twice?
The pattern traces back to how few times Annual actually trades. With only two to four rebalances across a whole test, one weak final year is not diversified away by anything else, it simply is the result. The 12-month configuration happened to string together four positive market periods in a row. The optimiser itself made the same kind of calculation each time, so that outcome reflects which periods fell inside a small sample, not a more skilled process.
Two of the three Annual configurations show the identical shape underneath: one or more strong early periods, followed by a losing final period that erodes much of the prior gain. The 24-month Annual run lost 8.0 percent in its final period after concentrating all four holdings at the 25 percent cap. The 36-month Annual run, on just two rebalances, lost 12.5 percent in its final period and finished up only 6.3 percent overall, against 31.1 percent for a simple equal-weight portfolio over the same stretch.
Why the optimiser concentrates its holdings
Concentrating into a handful of names, three to five in this study, several pinned at the 25 percent cap, is mean-variance optimisation doing its job. The framework selects whichever combination of assets it estimates will deliver the best return for a given level of risk, weighing each name's estimated volatility and its correlation with every other name, not simply which stocks have performed best. That is the diversification principle at the core of modern portfolio theory. Those names formed the most favourable risk-adjusted combination the optimiser could find at that point, not a bet on a few winners, and the cap exists specifically to stop that combination from concentrating further into any single name.
The wrinkle is that those return and risk estimates come from a short, noisy trailing window. A documented property of mean-variance optimisation is that noisy estimates can shift meaningfully as the window rolls forward, even when an asset's true underlying risk and return haven't changed. That means the best combination identified at one rebalance can look different at the next, not because the optimiser's logic changed, but because its inputs did.
That instability, not concentration on its own, is what makes Annual rebalancing specifically fragile. Each Annual decision locks in one such estimate for a full year, with no chance to revise it if that estimate turns out weak. With only two to four such decisions across the whole test, one weak year has nowhere to hide, which is exactly the pattern described above.
The selection logic itself is not naive return-chasing, though. Nvidia, despite ranking among the highest-returning names in the entire universe, sat at zero weight in the study's Annual-rebalance holdings from October 2022 through April 2024, spanning a large part of its own rally. A rule that simply chased the highest trailing return could never produce that gap. The optimiser was weighing Nvidia's volatility and its correlation to other favoured names heavily enough to prefer a different combination for a year and a half.
Does the calendar month you start on matter too?
Yes, and this compounds the fragility problem. ApexHub re-ran six of the thirteen configurations twelve times each, once for every possible calendar starting month, holding everything else fixed. Quarterly rebalancing was the only frequency where the calendar anchor never changed who won: equal-weight led across all 12 starting months at the 12-month window, and the optimiser led across all 12 at the 24-month window.
Semi-Annual and Annual rebalancing were both close to a coin flip across starting months, winning in only 5 to 8 of the 12 tested. Worse, the optimiser's own spread of possible outcomes across those starting months ran 3 to more than 6 times wider than equal-weight's spread, and that gap widened further at lower rebalance frequencies. An investor who starts Annual rebalancing in one month rather than another could see meaningfully different results, through no fault of their strategy.
What about trading costs?
Rebalancing less often reliably cut trading costs, and this part of the finding held up cleanly. Transaction costs fell by roughly 7 to 8.6 times between Monthly and Annual rebalancing, depending on the training window. That is a real, repeatable saving any investor can plan around.
| Training Window | Monthly | Quarterly | Semi-Annual | Annual | Monthly-to-Annual Reduction |
|---|---|---|---|---|---|
| 12-month | $38,911 | $21,810 | $10,420 | $5,499 | 7.1x |
| 24-month | $12,570 | $6,411 | $3,113 | $1,467 | 8.6x |
| 36-month | $3,375 | $1,697 | $1,039 | $498 | 6.8x |
Source: ApexHub Insights, Portfolio Optimisation Walk-Forward Study, transaction cost by rebalance frequency at each training window.
Fewer rebalances simply mean fewer trades, and each saving holds regardless of which frequency ends up performing best in that window. Management fees move the other way, they scale with the portfolio's value rather than how often it trades, so they run slightly higher wherever a configuration happened to grow more. That is a real cost too, but not one an investor can reduce by rebalancing less.
The result that matters most
Two findings stand out above everything else in this study: how the 36-month training window performed, and how Quarterly rebalancing held up across different calendar starting months.
First, the 36-month window. At that training window, the optimised strategy lost to a simple equal-weight portfolio at every single rebalance frequency tested. That window uses the longest lookback, and is the closest of the three tested to how a long-horizon investor would actually estimate risk and return in practice. Unlike Annual's boom-and-bust pattern, this result cannot be waved away as a small sample. Monthly rebalancing at this window still ran 24 separate rebalances, comparable in count to the configurations that performed best at the 12-month window, and it still lost to equal-weight. So did Quarterly and Semi-Annual. This is the study's most robust finding, not its most fragile one, and the report treats it as the single result that should carry the most weight of anything in the study:
The value demonstrated in this study is not that optimisation reliably beats equal-weight, the evidence on that question is mixed and depends heavily on configuration. The value is that this tool made the dependency itself visible and measurable.
Before this study, there was no way to know that a 36-month lookback reverses what a 12-month lookback seems to show, or that a calendar start date alone can swing a result by more than 50 points of annualised return.
Second is the Quarterly's consistency across calendar months. Put together with the earlier frequency comparison, that consistency makes Quarterly the standout in this sample. It was one of the two steadiest performers overall, and the only frequency whose relative performance held up regardless of which month an investor started in. Semi-Annual matched it on the frequency comparison but did not carry that same calendar consistency, so its result depends more on timing than the headline comparison alone suggests. That distinction is arguably this study's second most important takeaway, after the 36-month finding.
It is still a takeaway from one sample, not a rule to adopt blind. This is one 50-stock, technology-heavy universe over one test period, and there is no guarantee the same ranking holds for a different portfolio, a different sector mix, or a different market cycle. That is exactly why a walk-forward tool like this one is useful, it lets an investor test their own holdings and history instead of borrowing this sample's answer and assuming it transfers unchanged.
Bottom line for investors: the takeaway is not "rebalance annually" or "rebalance quarterly", it is that training window and rebalance frequency interact, and a rule tested at only one window is not safe to generalise. Of the two steadiest performers, Quarterly is the more defensible single default in this sample, since it was also the only frequency whose relative performance held up regardless of which calendar month an investor started in, a consistency Semi-Annual did not share. Annual rebalancing should be treated as high-variance, not high-conviction, sized around its demonstrated range of outcomes rather than its single best result. None of this is a rule to adopt blind, it is specific to this 50-stock, technology-heavy universe over this test period, which is exactly why testing your own portfolio, rather than borrowing someone else's ranking, is the safer approach, and exactly the kind of decision a walk-forward tool like this one exists to inform.
The full walk-forward study, including the results for all 13 configurations, transaction costs by rebalance frequency and the complete methodology, is available for download below.
Free, an account is required.
Source: ApexHub Insights, Portfolio Optimisation Walk-Forward Study (Rebalancing Frequency and Training-Window Sensitivity in a Constrained, Mean-Variance Optimised Equity Portfolio), report dated 3 September 2026. This report is a historical, backtested analysis intended to inform portfolio construction and governance decisions. It is not investment advice, and past walk-forward performance, even out-of-sample, is not a guarantee or reliable predictor of future results.
Question or correction?
Spotted a figure that looks wrong, or want something in this note explained? It comes straight to us, and is not published.
Related research
Run the numbers
- Investment Strategies
Backtested allocation rules across the covered universe.
- Financial Planner
Goals, income, debt and net worth projected in one plan.
- Statement Analyzer
Turn bank statements into categorised income and expenses.
- Stock Screener
Screen the NSE on the same fundamentals this note is built on.