Sharpe Ratio Explained: Optimising Portfolio Returns Without Taking Excess Risk
Portfolio optimization is the cornerstone of smart investing. The ApexHub Insights Modern Portfolio Optimization Tool uses the Sharpe Ratio to help investors allocate their investments in a way that maximizes returns for every unit of risk taken. This approach applies real asset performance data, risk-free rates, and investor constraints to construct the most efficient portfolio possible.
Understanding the Sharpe Ratio
The Sharpe Ratio measures how much excess return you earn for the volatility you endure. It is calculated as:
Sharpe Ratio = (Portfolio Return − Risk-Free Rate) / Portfolio Volatility
A higher Sharpe Ratio means the portfolio provides better returns per unit of risk. It is the key metric for identifying the efficient frontier — the set of optimal portfolios that offer the best possible expected return for a defined level of risk.
Example: Portfolio Optimization Using Sharpe Ratio
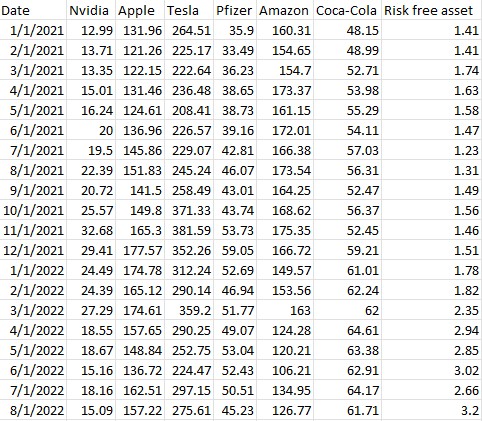
An investor, visits Our Portfolio Optimization Tool, and uploads a CSV dataset containing daily/monthly/annual market prices for their preferred assets for investments. These could be Nvidia, Tesla, Apple, Amazon, Pfizer, and Coca-Cola and more or less. Ensures the dataset includes a risk-free rate (e.g., 10-year government bond yield) as last column, acting as proxy for risk free assets. For example, the dataset could look like this (Note you can use any stocks,bonds etc. no limits):
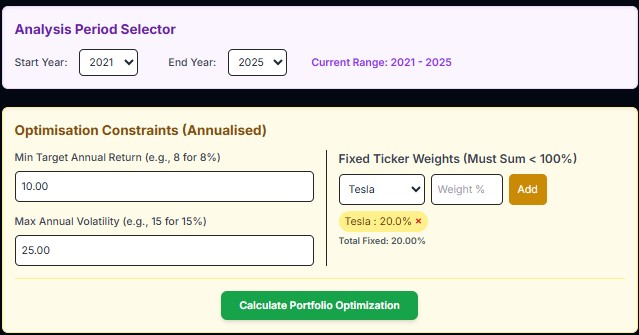
Now enter the constraints, including your risk target and expected minimum return & fixed weights (if you prefer it):
Analysis Period: 2021–2025
Frequency: Monthly
Risk-Free Rate: Annualized
Optimization Constraints:
- Minimum Target Return: 10%
- Maximum Volatility: 15%
- Fixed Weight: Tesla at 25%. The point of this is that some clients will not feel satisfied if they do not invest in certain stocks. To meet their expectation, analysts allow them to propose their preferred allocation.
After running the optimization:
| Metric | Equally Weighted | Optimized (Max Sharpe) |
|---|---|---|
| Sharpe Ratio | 0.8605 | 1.4165 |
| Annual Return | 23.765% | 38.587% |
| Annual Volatility | 23.718% | 24.872% |
See detailed optimization results below:
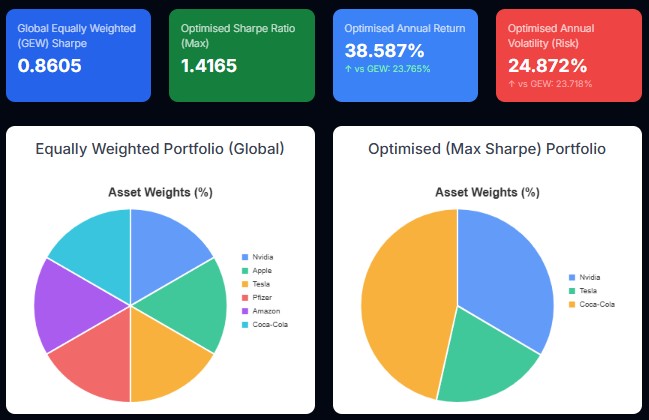
This means the optimized portfolio increased return by over 14 percentage points but increased risk by less than 2 points while keeping it within our acceptable annual volatility of 25%. As a result, the proposed optimised portfolio achieved a 65% higher Sharpe Ratio, which means a better return per unit of risk we have assumed compared to an global equally weighted portfolio (GEW) that comprise of all 5 stocks.
Optimized Portfolio Allocation
| Ticker | Optimized Weight | Allocation Notes |
|---|---|---|
| Coca-Cola | 46.50% | Low volatility, stable returns |
| Nvidia | 33.50% | High growth |
| Tesla | 20.00% | Diversifies growth exposure, pre-set fixed weight |
This allocation shows that diversification across defensive and growth assets creates a balanced, high-efficiency portfolio. Despite Nvidia’s strong returns, the optimizer limits its weight to control overall volatility.
Assuming you are planning to invest $100,000, this optimized portfolio suggests that, to optimize the Sharpe Ratio, you need to allocate this investment as follows:
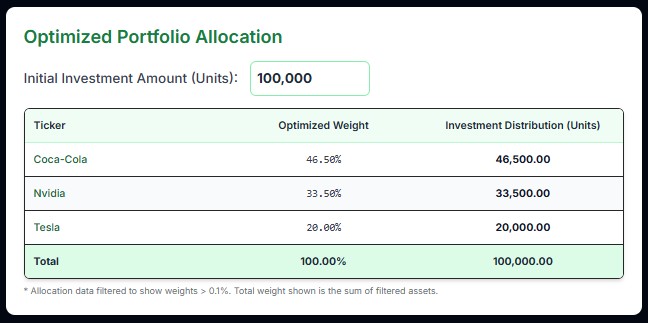
Notice that the optimized portfolio above does not include all stocks. It excludes Pfizer, Amazon, and Apple. Why? Because investing in these stocks will not help you optimise your portfolio returns given your risk profile.
Why Sharpe Ratio Optimization Matters
- Balances return and risk instead of chasing performance blindly.
- Removes emotional bias by relying on quantitative data.
- Improves capital efficiency, ensuring every dollar invested works harder.
- Accounts for correlations, preventing overexposure to similar risk sources.
- Adapts to investor preferences, such as target return or volatility caps.
In this example, the Sharpe-optimized portfolio allocates more to Coca-Cola due to its stabilizing effect and reduces exposure to highly volatile stocks like Tesla and Pfizer. The result is a portfolio that maximizes performance without increasing risk.
Statistical Insight (2021–2025)
| Asset | Annual Return | Annual Volatility | Correlation with Nvidia |
|---|---|---|---|
| Nvidia | 96.9% | 51.4% | 1.0000 |
| Apple | 18.1% | 25.0% | 0.5285 |
| Tesla | 32.5% | 61.2% | 0.4228 |
| Pfizer | -5.2% | 23.8% | 0.2104 |
| Amazon | 11.3% | 31.4% | 0.6764 |
| Coca-Cola | 9.0% | 16.0% | -0.0800 |
The correlation matrix highlights that Coca-Cola has negative correlation with Nvidia, improving diversification and lowering total risk. Combining such assets is the essence of Modern Portfolio Theory (MPT).
Practical Application for Investors
Visit Our Portfolio Optimization Tool:
- Upload your portfolio data (stocks, bonds, cryptos etc plus risk-free rate).
- Set constraints for minimum return and maximum volatility.
- Run optimization to identify the best asset weights.
- Compare your current allocation to the optimized one.
- Adjust your holdings to align with the new efficient frontier.
Key Takeaway
The Sharpe Ratio is not only a measure of portfolio performance but a tool for decision-making. It helps investors design portfolios that achieve higher returns with lower risk through evidence-based optimization.
Use the ApexHub Insights Modern Portfolio Optimization Tool to test your current portfolio and explore optimal allocations.
Visit Our Portfolio Optimization Tool to start optimizing your investments today. Whether you are just getting started or want to do your periodic rebalancing, this tool will help achieve just that.
Pro tip: To maintain your target risk-return profile, research suggests rebalancing semi-annually, annually, or whenever your asset weights drift by more than 5–10%. Use this tool to calculate your new target weights and stay on track. This minimizes trading costs and taxes while ensuring your risk remains within your comfort zone. Try it!
Important Disclaimers
- Past performance is not a guarantee of future results.
- The example above uses historical data for illustration only.
- Transaction costs, taxes, liquidity constraints, and slippage were not included in the calculations.
- You should consider your personal objectives and risk tolerance before applying optimization outputs.
Thus, the Sharpe Ratio is a valuable guide, but real-world investing always involves uncertainty. Use our optimization tool as part of a comprehensive, informed investment strategy.