Equity Group Profit Rises 32% In 9M2026 As Total Assets Hit Kshs2.15 Trillion
Equity Group Holdings grew profit attributable to equity holders 31.94 percent to Kshs68.77 billion in the nine months ended 30 September 2026, as net interest income rose 15.08 percent and gross non-performing loans fell 14.44 percent.
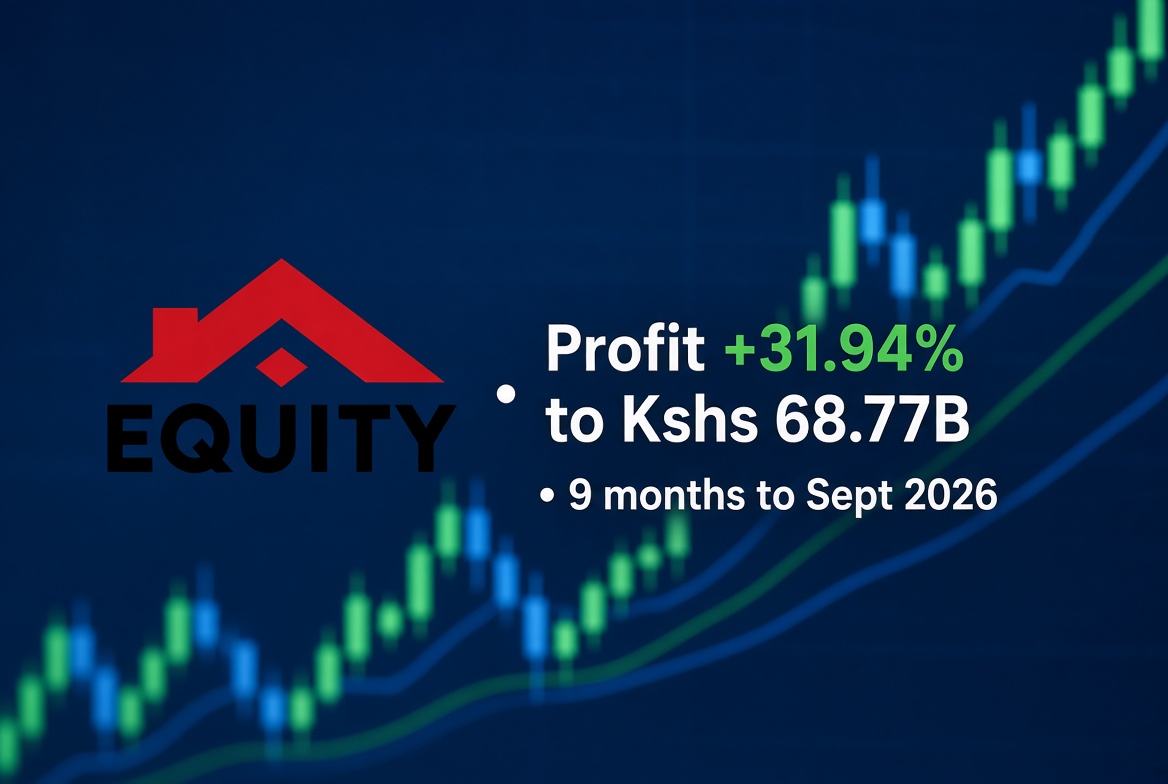
Equity Group profit rises 31.94 percent in 9M2026 as total assets cross Kshs2.15 trillion
Equity Group Holdings grew profit attributable to equity holders 31.94 percent to Kshs68.77 billion in the nine months ended 30 September 2026, from Kshs52.12 billion a year earlier. Earnings per share rose 31.93 percent to Shs18.22 from Shs13.81. Total assets grew 18.27 percent to Kshs2.15 trillion from Kshs1.82 trillion a year earlier.
Net interest income grew 15.08 percent to Kshs107.70 billion, as interest income rose 8.39 percent while total interest expense actually fell 9.02 percent on lower funding costs. Non-interest income grew faster still, up 34.57 percent to Kshs84.35 billion, which pushed total operating income up 22.90 percent to Kshs192.05 billion. Loan loss provisions fell 12.25 percent to Kshs10.21 billion even as the loan book grew, a combination that lifted profit well ahead of revenue growth.
Equity Group Holdings 9M2026 Snapshot (Group, Kshs millions, nine months ended 30 September)
| Metric | 9M2026 | 9M2025 | YoY Change |
|---|---|---|---|
| Interest income, loans and advances | 85,625.4 | 78,286.7 | +9.37% |
| Interest income, government securities | 50,488.2 | 45,777.7 | +10.29% |
| Total interest income | 140,417.4 | 129,549.9 | +8.39% |
| Interest expense, customer deposits | (24,528.4) | (28,748.3) | -14.68% |
| Total interest expense | (32,721.8) | (35,966.3) | -9.02% |
| Net interest income | 107,695.7 | 93,583.6 | +15.08% |
| Total non-interest income | 84,353.6 | 62,685.5 | +34.57% |
| Total operating income | 192,049.3 | 156,269.1 | +22.90% |
| Loan loss provision | (10,212.1) | (11,637.1) | -12.25% |
| Staff costs | (35,612.6) | (28,567.2) | +24.66% |
| Other operating expenses | (56,380.9) | (50,480.2) | +11.69% |
| Total operating expenses | (102,205.6) | (90,684.6) | +12.70% |
| Profit before tax and exceptional items | 89,843.7 | 65,584.5 | +36.99% |
| Tax charge | (18,385.7) | (11,460.8) | +60.42% |
| Profit after tax, before minority interest | 71,458.0 | 54,123.6 | +32.03% |
| Attributable to non-controlling interests | (2,690.0) | (2,004.9) | +34.17% |
| Attributable to equity holders of the parent | 68,768.0 | 52,118.7 | +31.94% |
| Earnings per share (Shs) | 18.22 | 13.81 | +31.93% |
Source: Equity Group Holdings plc unaudited Group results for the nine months ended 30 September 2026.
- To analyse Equity Group's reported numbers over the last four years, click here, or see the statements themselves on its financials view.
The effective tax rate rose to 20.46 percent from 17.47 percent, as the current tax charge jumped 126.02 percent, far outpacing the 36.99 percent growth in profit before tax. That increase is why profit after tax grew more slowly than profit before tax, even with a favorable swing in deferred tax working the other way. Profit attributable to non-controlling interests, mostly tied to Equity's regional subsidiaries outside Kenya, grew 34.17 percent to Kshs2.69 billion, broadly in step with the Group's own profit growth, not a distortion of it.
Total assets grew 18.27 percent to Kshs2.15 trillion from Kshs1.82 trillion a year earlier. Net loans and advances to customers grew 17.20 percent to Kshs1.01 trillion, while customer deposits grew 17.72 percent to Kshs1.58 trillion. Borrowed funds fell 10.82 percent to Kshs59.79 billion, and total shareholders' funds grew 21.92 percent to Kshs369.70 billion. Gross non-performing loans fell 14.44 percent to Kshs110.52 billion, even as the loan book itself grew, pointing to improving loan quality instead of a larger loan book simply diluting the NPL ratio.
Equity Group Holdings 9M2026 Key Ratios
| Ratio | 30 Sep 2026 | 30 Sep 2025 |
|---|---|---|
| Net interest margin | 5.01% | 5.15% |
| Cost-to-income ratio | 47.90% | 50.58% |
| Effective tax rate | 20.46% | 17.47% |
| Return on assets (ROA) | 3.20% | 2.87% |
| Return on equity (ROE) | 18.60% | 17.19% |
| Equity-to-assets ratio | 17.20% | 16.69% |
| Loans-to-deposits ratio | 63.62% | 63.90% |
| Gross NPLs to net loans and advances | 10.97% | 15.02% |
| Core capital to risk-weighted assets | 18.20% | 16.60% |
| Total capital to risk-weighted assets | 19.50% | 18.30% |
| Liquidity ratio | 60.10% | 61.00% |
Source: ApexHub Insights calculations from Equity Group Holdings' unaudited Group results.
Net interest margin narrowed slightly to 5.01 percent from 5.15 percent, even as net interest income grew in absolute terms, since total assets grew faster than net interest income did. The cost-to-income ratio improved to 47.90 percent from 50.58 percent, since total operating income grew faster than operating expenses. That is a real efficiency gain, separate from the loan loss provision swing already discussed above.
Returns improved across the board. ROA rose to 3.20 percent from 2.87 percent and ROE rose to 18.60 percent from 17.19 percent, both still nine-month figures, not annualized ones. The loans-to-deposits ratio held essentially steady at 63.62 percent from 63.90 percent, with deposits and loans growing at a similar pace.
- Track Equity Group's margin and cost trend on its efficiency view, or compare it with other listed banks on its peers view.
Capital and liquidity both stayed well above the Central Bank of Kenya's statutory minimums. Core capital covered 18.20 percent of risk-weighted assets against a 10.5 percent minimum, up from 16.60 percent a year earlier, and total capital covered 19.50 percent against a 14.5 percent minimum. The liquidity ratio stood at 60.10 percent against a 20.0 percent minimum, little changed from 61.00 percent a year earlier.
No interim dividend was declared for the period, consistent with a year earlier.
- Equity Group's payout history sits on its dividend view. To track record dates and payment dates across the NSE, visit ApexHub Insights - Upcoming Dividends.
Equity Group's non-performing loan trend sits inside the same broader industry question raised by other Kenyan banks reporting this quarter: whether asset quality is actually improving as the economy settles, or whether banks are merely outgrowing a static bad-loan problem. A gross NPL book that shrank 14.44 percent while the loan portfolio grew 17.20 percent is the stronger version of that story, since the absolute stock of non-performing loans itself came down.
Bottom line for investors: Equity Group's 9M2026 results are strong across the board, profit attributable to equity holders up 31.94 percent, net interest margin broadly stable, and cost-to-income improving. Non-performing loans fell in absolute terms even as the loan book expanded. The effective tax rate rose sharply, to 20.46 percent from 17.47 percent, which is worth watching since it is now a real drag on how much of pretax profit growth reaches shareholders. Capital and liquidity buffers remain well clear of regulatory minimums, leaving room for continued growth. Investors should watch the tax rate trend alongside the usual asset-quality and margin metrics, since a further increase would eat further into otherwise strong underlying growth.
Source: Equity Group Holdings plc unaudited Group results for the nine months ended 30 September 2026.
Question or correction?
Spotted a figure that looks wrong, or want something in this note explained? It comes straight to us, and is not published.
Related research
Run the numbers
- Financial Planner
Goals, income, debt and net worth projected in one plan.
- Statement Analyzer
Turn bank statements into categorised income and expenses.
- Stock Screener
Screen the NSE on the same fundamentals this note is built on.
- Income Tax Calculator
Run your own PAYE, reliefs and net pay on the current bands.