Kenya Pipeline Company IPO Valuation: Cash Flows Point to a Premium, Not a Re-Rating
Valuing Kenya Pipeline Company: A Cash-Flow–Driven Perspective
Kenya Pipeline Company (KPC) sits at a unique intersection of infrastructure, regulation, and national strategic importance. It is neither a commodity producer nor a consumer-facing oil marketer. Instead, it is a capital-intensive, long-life logistics utility, whose economic value is driven far less by short-term earnings volatility and far more by throughput volumes, asset utilisation, capital discipline, and the cost of capital applied to those cash flows.
This distinction matters. Infrastructure businesses are often mis-valued when analysed through growth narratives or point-year forecasts rather than steady-state economics. In KPC’s case, this risk is heightened by the presence of long-dated management forecasts that exhibit extreme volatility, particularly in capital expenditure, and that are accompanied by strong auditor disclaimers regarding their hypothetical nature.
This analysis therefore brings together:
- a grounded view of KPC’s regulated infrastructure business model,
- conservative, internally consistent operating assumptions,
- a normalised and economically defensible capex framework,
- a transparent construction of the discount rate,
- three explicit valuation scenarios, and
- cross-checks using both DCF and relative multiples.
The conclusion is not that KPC is fundamentally mis-valued, but that the IPO price embeds a clear valuation premium, requiring investors to underwrite future execution and capital discipline ahead of demonstrated, return-generating free cash flows.
1. Framing the Business Model
KPC’s revenues are driven primarily by:
- fuel transportation volumes through its pipeline network,
- storage and handling services at terminals, and
- regional export demand, particularly transit volumes to neighbouring countries.
Prices are largely regulated or tariff-based, materially dampening earnings volatility compared with upstream or integrated energy companies. This has two important implications for valuation:
- Growth is incremental and capacity-led, not discretionary or explosive.
- Risk is best captured through the discount rate and capital allocation assumptions, not through aggressive operating volatility.
KPC should therefore be analysed more like a regulated logistics utility than like an oil marketer or exploration company.
2. Normalised Operating Assumptions (Base Case)
Revenue Growth
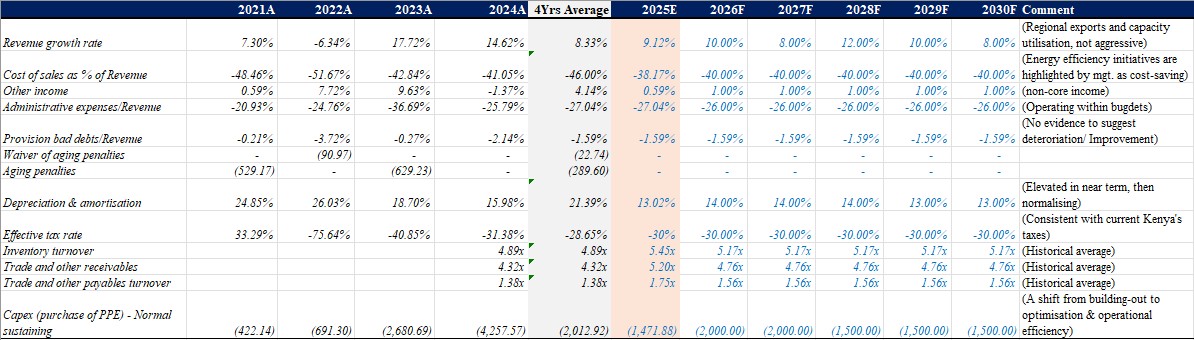
Historical revenue growth between 2021 and 2024 averaged approximately 8.3%, albeit with material year-to-year volatility. Incorporating actual 2025 performance and explicitly recognising Kenya’s 2027 election cycle, the base-case (Scenario A) assumes a moderated and economically plausible growth path:
- 2026: 10.0%
- 2027: 8.0% (election-related disruption)
- 2028: 12.0% (post-election recovery)
- 2029: 10.0%
- 2030: 8.0%
This profile reflects:
- steady regional fuel demand,
- improved utilisation of existing assets,
- temporary disruption during election years,
- and no reliance on aggressive tariff increases or structural demand shocks.
The explicit election dip and recovery enhance credibility and avoid smoothing away known macro risks.
Cost Structure and Margins
Cost of sales is normalised at 40% of revenue, an improvement versus the historical four-year average of ~46%. This assumption is grounded in:
- management-disclosed energy-efficiency initiatives,
- post-expansion operational optimisation,
- and scale benefits on a largely fixed infrastructure base.
Administrative expenses are held at 26% of revenue, broadly consistent with historical experience and reflective of budgetary discipline rather than structural margin expansion.
Bad-debt provisions are maintained at 1.59% of revenue, in line with long-run averages, as there is no evidence of sustained improvement or deterioration in counterparty quality.
Other income is conservatively capped at 1.0% of revenue, avoiding any valuation dependence on non-core or volatile income streams.
3. Capital Expenditure: Normalisation vs Management Forecasts
Capital expenditure is the single most important driver of divergence between valuation outcomes.
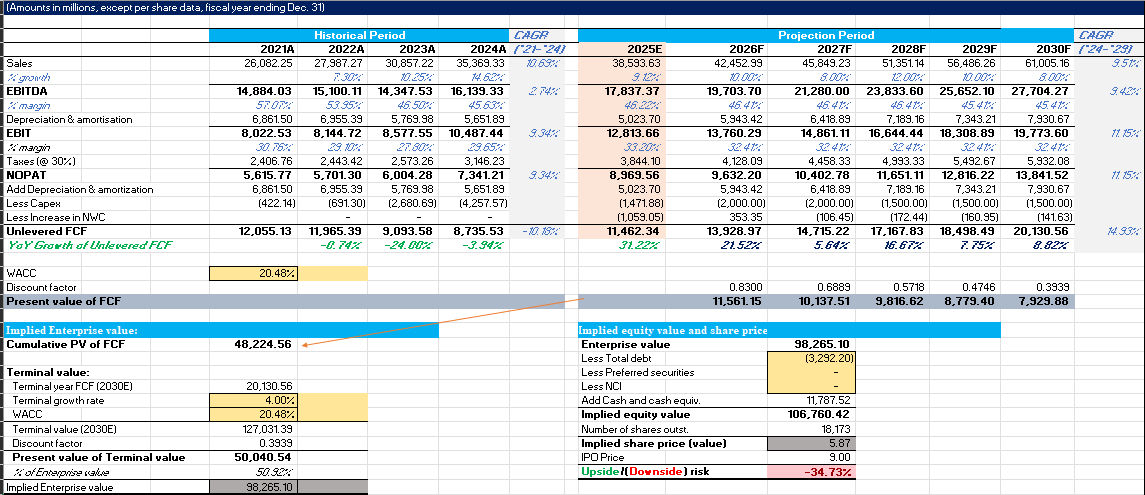
Scenario A (Base Case): Normalised Capex
In the base-case valuation, capex is normalised to reflect the economics of a mature, regulated infrastructure operator:
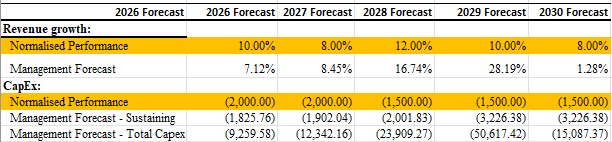
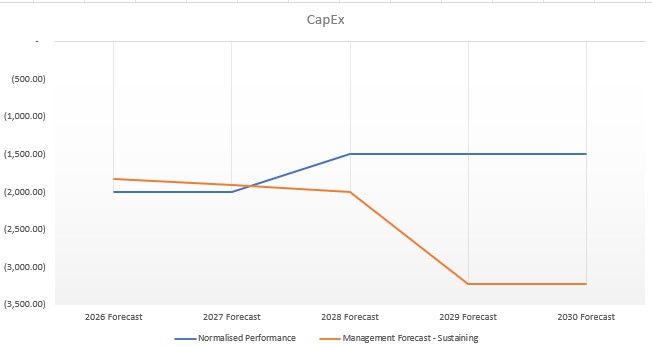
- 2026–2027: KSh 2.0bn annually
- 2028–2030: KSh 1.5bn annually
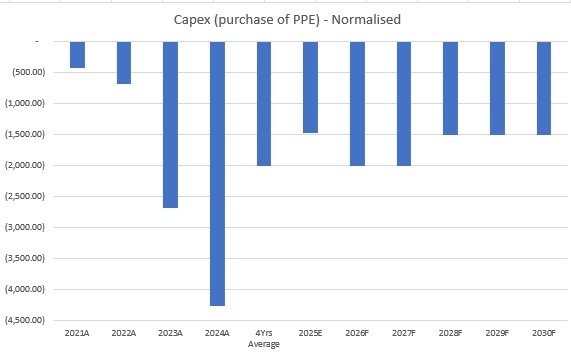
This reflects:
- a shift from asset build-out to optimisation,
- sustaining investment for safety and reliability,
- and consistency with observed depreciation levels.
By doing so, we hoped to avoid the common DCF error of assuming a post-expansion capex cliff while remaining economically grounded.
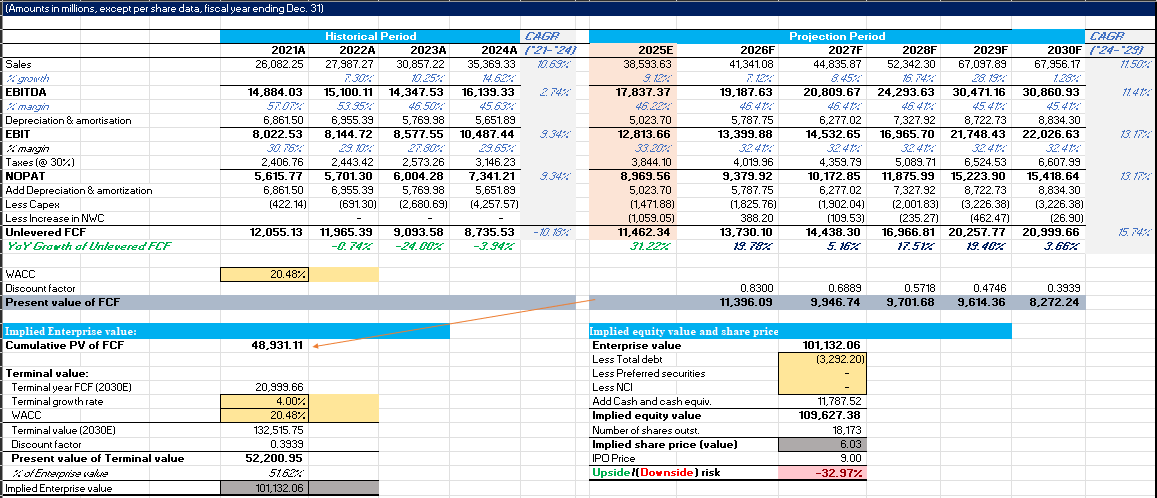
Scenario B: Management Growth with Sustaining Capex Only
Scenario B applies management’s revenue growth assumptions, including strong post-2027 acceleration, but limits capex strictly to management-defined sustaining levels:
- capex rising structurally from ~KSh 1.8bn to ~KSh 3.2bn annually.
This scenario tests whether growth optimism alone is sufficient to justify the IPO price if capital discipline is maintained.
Scenario C: Management Growth with Total Capex
Scenario C applies management’s full disclosed capex, including:
- large “new PP&E” projects,
- intangible asset investments,
- and highly uneven, front-loaded spending.
Cumulative capex under this scenario approaches KSh 110bn, with single-year outlays exceeding KSh 50bn.
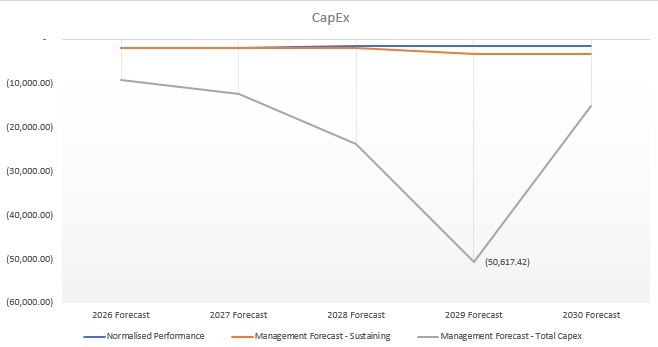
Critically:
- there is no disclosed linkage between these investments and incremental throughput,
- margins do not step-change,
- and IPO proceeds flow to the Government of Kenya, not to KPC.
Thus, without further disclosures, the new CapEx, as highlighted in the KPC management forecasts, are not well justified & raises some concerns. Indeed, while Auditors routinely describe prospective financial information as being based on hypothetical assumptions, reflecting the inherent uncertainty of forecasting, in this case the reporting accountants, PwC, go further, explicitly stating that no opinion is expressed on the validity or reasonableness of management’s assumptions and that the forward-looking information cannot be fully deemed, at this point, to constitute a fair presentation under IFRS. This rainforces the need to treat management forecasts as illustrative scenarios rather than valuation-grade inputs.
This scenario is therefore best interpreted as a stress test of capital intensity, not a valuation base case.
4. Free Cash Flow Outcomes Across Scenarios
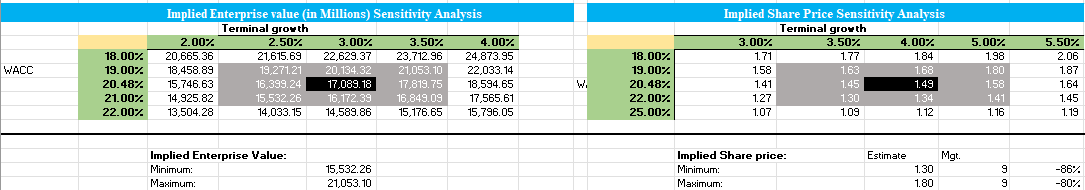
Scenario A: Normalised (Base Case)
- Implied equity value per share: ~KSh 5.87
- Implied equity value per share range: ~KSh 5.32–6.70
- IPO price is Ksh.9 per share.
- Downside to IPO price: ~26–41%
Free cash flow grows steadily, with election-year softness followed by recovery. Valuation is driven by steady-state economics, not optimism.
Sensitivity Analysis:
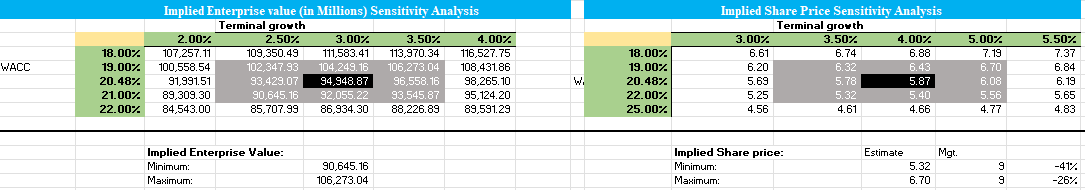
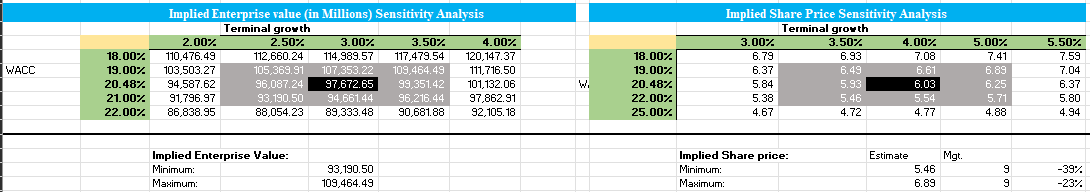
Scenario B: Management Growth + Sustaining Capex
- Implied equity value per share: ~KSh 6.03
- Implied equity value per share range: ~KSh 5.46–6.89
- IPO price is Ksh.9 per share.
- Downside to IPO price: ~23–39%
Even granting management’s growth narrative, the IPO price still leads cash-flow realisation, implying a valuation premium.
Sensitivity Analysis:
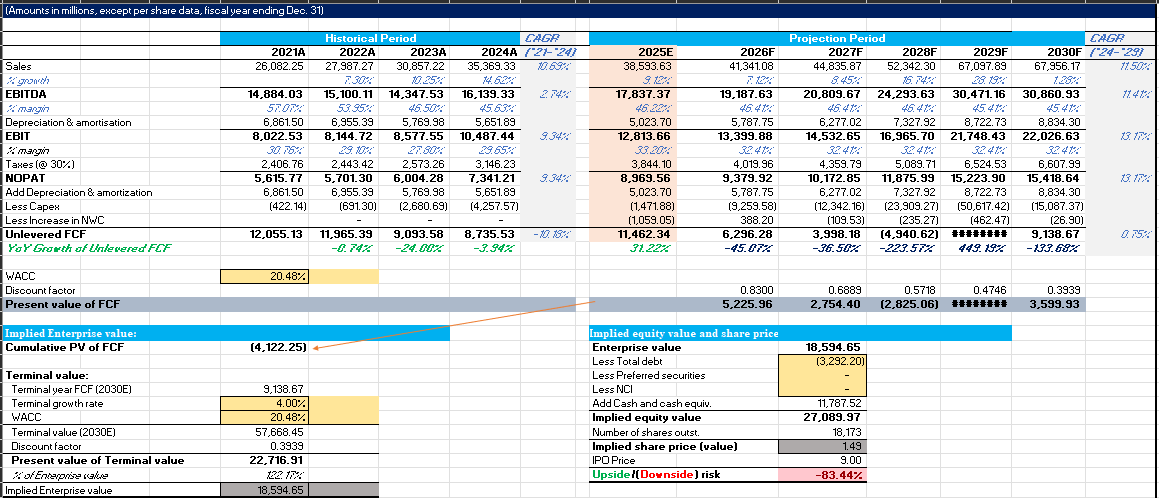
Scenario C: Management Growth + Total Capex
- Implied equity value per share: ~KSh 1.49
- Implied equity value per share: ~KSh 1.30–1.80
- IPO price is Ksh.9 per share.
- Downside to IPO price: >80%
This scenario highlights capital allocation risk, not a realistic valuation outcome. It demonstrates that growth alone cannot compensate for unchecked capital intensity.
Sensitivity Analysis:
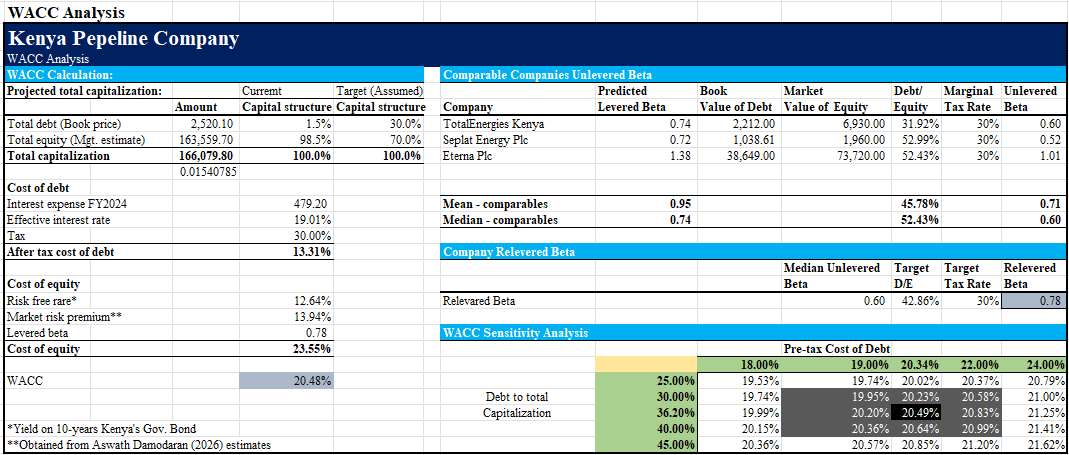
5. Cost of Capital: Anchoring the Valuation
A forward-looking capital structure of 30% debt / 70% equity is assumed, consistent with infrastructure assets and state-linked enterprises.
- After-tax cost of debt: ~13.3%
- Cost of equity: ~23.6%
- Resulting WACC: 20.48%
This WACC is high by global standards, but appropriate given:
- sovereign risk,
- currency risk,
- and institutional constraints.
Importantly, valuation sensitivity is driven far more by WACC than by near-term earnings assumptions.
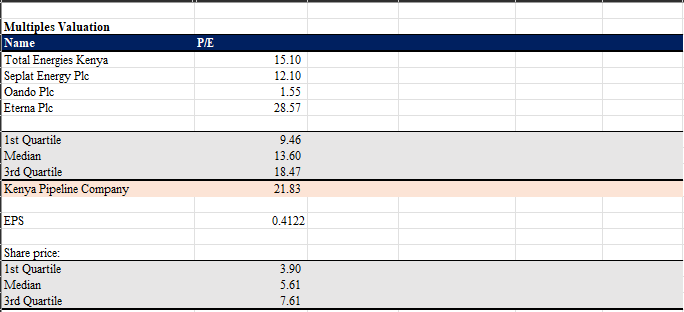
6. Multiples Cross-Check
A P/E comparison against Africa-listed peers shows:
- Median P/E: ~13.6x, with a price of Ksh.5.61 per share.
- Upper quartile: ~18.5x, with a price of Ksh.7.61 per share.
- KPC at IPO: ~21.8x
- KPC IPO price range: Ks.5.61-7.61 per share.
- Downside risk: 15% to 38%
KPC therefore lists at a clear premium, justified by:
- earnings stability,
- monopoly infrastructure characteristics,
- and strategic national importance.
However, the premium is not supported by near-term cash-flow delivery, reinforcing the DCF conclusions.
7. Interpreting the IPO Price
Taken together, the evidence points to a consistent conclusion that:
The Kenya Pipeline Company IPO is premium-priced, not mis-priced.
Investors at KSh 9.00 per share are paying upfront for:
- future growth certainty,
- disciplined capital allocation (possible, only in normalised & sustained CapEx, not with the new PP&E),
- and execution without slippage,
but before those outcomes are fully reflected in free cash flow.
Final Thought
This current valuation does not rely on heroic assumptions, margin expansion narratives, or financial engineering. It treats KPC for what it is, a regulated, capital-intensive infrastructure business operating in a high-risk macro environment.
At the IPO price, investors are not buying a bargain, but they are also not buying a broken story. They are buying long-dated cash-flow potential at a premium, with returns likely driven by dividends and stability rather than valuation re-rating.
That is not a warning sign.
It is simply the economic reality of this IPO.
Disclaimer: This is NOT a financial advice. Information provided only for educational purposes. Do your own research and consult your certified financial adviser before making any investment decision. More about this disclaimer